

HOT TOPICS LIST
- MACD
- Fibonacci
- RSI
- Gann
- ADXR
- Stochastics
- Volume
- Triangles
- Futures
- Cycles
- Volatility
- ZIGZAG
- MESA
- Retracement
- Aroon
INDICATORS LIST
LIST OF TOPICS
PRINT THIS ARTICLE
by Chaitali Mohile
XLE has moved into the overbought area, and the daily price chart has formed a rising wedge. The sector is likely to witness a correction during the uptrend.
Position: N/A
Chaitali Mohile
Active trader in the Indian stock markets since 2003 and a full-time writer. Trading is largely based upon technical analysis.
PRINT THIS ARTICLE
WEDGE FORMATIONS
Energy Select Sector May Undergo Some More Correction
07/23/07 01:03:13 PMby Chaitali Mohile
XLE has moved into the overbought area, and the daily price chart has formed a rising wedge. The sector is likely to witness a correction during the uptrend.
Position: N/A
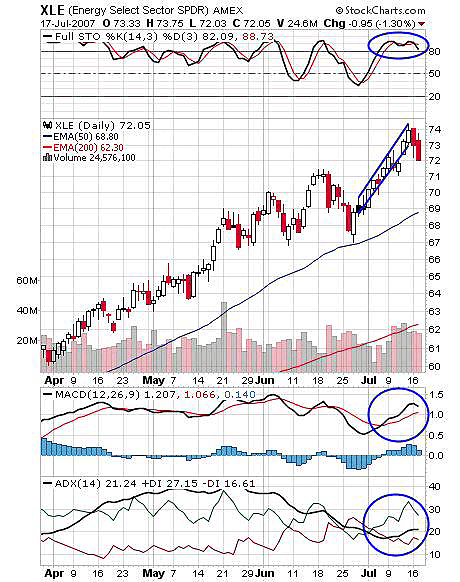
| Figure 1 shows the energy sector in a strong uptrend beginning its bullish rally from as low as $60 up to $74. The 50-day exponential moving average (EMA) shows the upward path of the sector. This support was tested once at the 67 level. In addition, price retraced more than once at this level, forming a strong support, though a higher high was also made. The rally that began from the 50-day EMA support formed a rising wedge. A rising wedge in an uptrend can bring a temporary fall in the price. Sometimes, this formation can be a continuation pattern as well. In the daily chart in Figure 1, the sector has already begun its down journey, confirming the formation to be a reversal. As a result, the price is likely to retrace to its low pivot. The volume shows a more volatile move than the price throughout the rally. |
|
| FIGURE 1: XLE, DAILY. The rising wedge can make price retrace to its low pivot, but the existing uptrend will sustain. |
| Graphic provided by: StockCharts.com. |
| |
| The stochastic (14, 3, 3) is in an overbought area, which has added pressure on the price correction. This indicator can move flat at the overbought level and carry on the bullish rally. But on the daily chart, the stochastic (14, 3, 3) failed to move flat, thus indicating the weakness in the bullish rally. The moving average convergence/divergence (MACD)(12, 26, 9) has tipped down, so it may retrace to its trigger line support. The average directional movement index (ADX)(14) indicates a developing uptrend with reducing bullish pressure and a weak bearish pressure. As a result, the uptrend could sustain, even though price may witness some correction. |
| The sector has already moved down $2 from the $74 level. Therefore, the 50-day exponential moving average (EMA) will be an important support level for this correction. A serious correction is not expected on this formation, but the lowest support of $67 should be observed. |
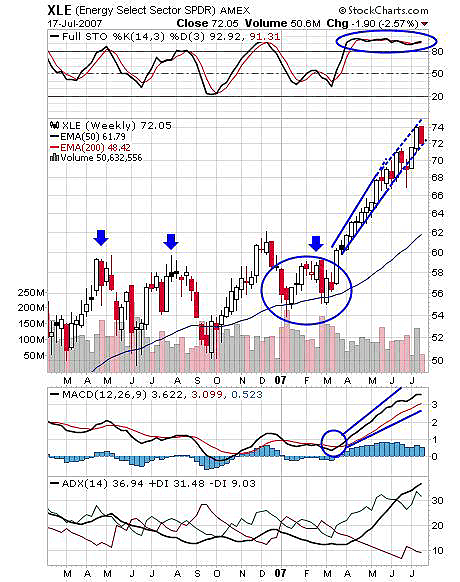
| In 2007, the Energy Select Sector SPDR(XLE) bottomed out in the range of 54-60. The 54 level was a support level and the 60 level was a very strong resistance, which pulled the price as low as $50 in 2006. As a result, violating this resistance required heavy volume and strong indicator support. Accordingly, the stochastic (14, 3, 3) offered good buying opportunity at the 20 level. The MACD (12, 26, 9) also had a bullish crossover, and the average directional movement index (ADX) (14) pulled up, with the positive directional index (+DI) gaining the trend strength. Thereafter, the ADX (14) moved steeply upward, indicating a good developing uptrend. |
|
| FIGURE 2: XLE, WEEKLY. The flat stochastic is likely to take a dip for creating space for a bullish rally. As a result, the price may undergo some correction. |
| Graphic provided by: StockCharts.com. |
| |
| The upward rally from 60 gave a handsome profit of $14 to traders. As a trader, I would be more watchful at this current level, as the extended rally from $68 to $74 is more volatile than the previous one. In addition, the stochastic (14, 3, 3) is highly overbought at 91 level and has moved flat for a longer period, so the indicator can correct to create some space for the upward rally (Figure 2). The other two indicators are very positive and support the upgoing rally. To conclude, I expect a smaller correction in the XLE with respect to the rising wedge and indicators on both time frames. |
Active trader in the Indian stock markets since 2003 and a full-time writer. Trading is largely based upon technical analysis.
| Company: | Independent |
| Address: | C1/3 Parth Indraprasth Towers. Vastrapur |
| Ahmedabad, Guj 380015 | |
| E-mail address: | chaitalimohile@yahoo.co.in |
Traders' Resource Links | |
| Independent has not added any product or service information to TRADERS' RESOURCE. | |
Click here for more information about our publications!
PRINT THIS ARTICLE

Request Information From Our Sponsors
- VectorVest, Inc.
- Executive Premier Workshop
- One-Day Options Course
- OptionsPro
- Retirement Income Workshop
- Sure-Fire Trading Systems (VectorVest, Inc.)
- Trading as a Business Workshop
- VectorVest 7 EOD
- VectorVest 7 RealTime/IntraDay
- VectorVest AutoTester
- VectorVest Educational Services
- VectorVest OnLine
- VectorVest Options Analyzer
- VectorVest ProGraphics v6.0
- VectorVest ProTrader 7
- VectorVest RealTime Derby Tool
- VectorVest Simulator
- VectorVest Variator
- VectorVest Watchdog
- StockCharts.com, Inc.
- Candle Patterns
- Candlestick Charting Explained
- Intermarket Technical Analysis
- John Murphy on Chart Analysis
- John Murphy's Chart Pattern Recognition
- John Murphy's Market Message
- MurphyExplainsMarketAnalysis-Intermarket Analysis
- MurphyExplainsMarketAnalysis-Visual Analysis
- StockCharts.com
- Technical Analysis of the Financial Markets
- The Visual Investor