HOT TOPICS LIST
- MACD
- Fibonacci
- RSI
- Gann
- ADXR
- Stochastics
- Volume
- Triangles
- Futures
- Cycles
- Volatility
- ZIGZAG
- MESA
- Retracement
- Aroon
INDICATORS LIST
LIST OF TOPICS
PRINT THIS ARTICLE
by Chaitali Mohile
The AMEX Composite retests the seller line in search of a breakout of the continuation pattern.
Position: Buy
Chaitali Mohile
Active trader in the Indian stock markets since 2003 and a full-time writer. Trading is largely based upon technical analysis.
PRINT THIS ARTICLE
ASCENDING TRIANGLES
AMEX Composite Forms Ascending Triangle
07/17/07 01:42:03 PMby Chaitali Mohile
The AMEX Composite retests the seller line in search of a breakout of the continuation pattern.
Position: Buy
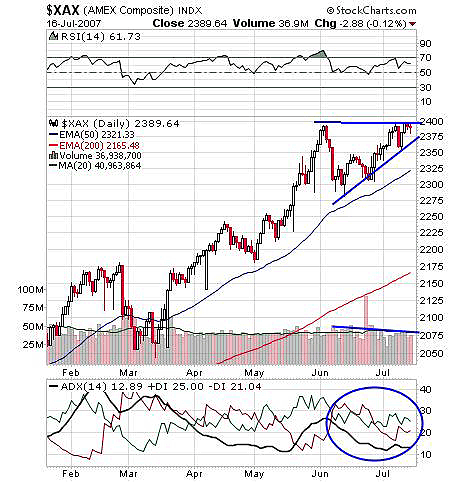
| The ascending triangle appears in an uptrend as a continuation pattern. In Figure 1, the AMEX Composite has remained in a strong uptrend. The resistance line at 2400 level is the seller's line, and the support line moving toward the seller's line is the buyer's line. The range between the seller's and buyer's line is also traded. Traders prefered to stay on the sidelines as the range continued to narrow. This reduced volume, as can be seen in the daily chart (Figure 1). The AMEX Composite is already trading at new highs, so the breakout of an ascending triangle will carry the index to higher levels. |
| An overbought relative strength index (RSI)(14) in early June soon drifted down to the 50 level and then moved in a narrow range, resulting in price consolidation. The RSI (14) is not moving above 70 with existing bullish pressure, thus indicating price consolidations. The average directional movement index (ADX) (14) does not indicate strength in either trend. The positive directional index (+DI) and negative directional index (-DI) are moving with equal pace, though +DI is marginally above -DI. From the ADX (14) we can only get a view of consolidation in absence of the strength in trend. In addition, as the range in the ascending triangle has narrowed, traders can wait for a breakout. |

|
| FIGURE 1: AMEX COMPOSITE, DAILY. The price is moving closer to the resistance line of the ascending triangle. The breakout of the triangle will lead to new levels in an ongoing bullish rally. |
| Graphic provided by: StockCharts.com. |
| |
| The confirmation on the breakout is suggested before going long this index. The AMEX Composite is likely to see the 100-point rally after the breakout. The 100-point rally is measured by the width of the triangle (2400 - 2300 = 100). So by adding 100 to the 2400 breakout level, the new level of 2500 can be calculated. |
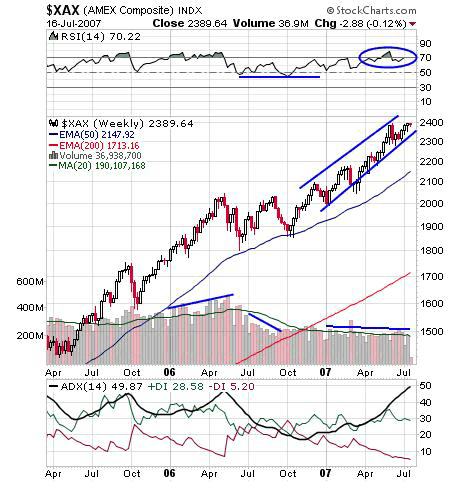
| In the weekly chart (Figure 2), the AMEX Composite is moving in a very bullish upward channel. This upward move began with the support of the 50-day exponential moving average (EMA). Meanwhile, the RSI (14) also rested twice on the 50 level before regaining bullish strength in an upward rally. The RSI (14) marginally moved below 70 from its overbought area to create some room for the present bullish rally above the 2400 level. The ADX (14) at the 49 level indicates an overheated uptrend, so trades can expect some consolidation around the 2400 level. |

|
| FIGURE 2: AMEX COMPOSITE, WEEKLY. The price is consolidating within the upward channel. |
| Graphic provided by: StockCharts.com. |
| |
| The ascending triangle breakout in a daily and consolidation breakout with the channel in weekly charts has resistance at the 2400 level. With this breakout, traders can find good buying opportunities with a target at the 2500 level. |
Active trader in the Indian stock markets since 2003 and a full-time writer. Trading is largely based upon technical analysis.
| Company: | Independent |
| Address: | C1/3 Parth Indraprasth Towers. Vastrapur |
| Ahmedabad, Guj 380015 | |
| E-mail address: | chaitalimohile@yahoo.co.in |
Traders' Resource Links | |
| Independent has not added any product or service information to TRADERS' RESOURCE. | |
Click here for more information about our publications!
PRINT THIS ARTICLE

Request Information From Our Sponsors
- StockCharts.com, Inc.
- Candle Patterns
- Candlestick Charting Explained
- Intermarket Technical Analysis
- John Murphy on Chart Analysis
- John Murphy's Chart Pattern Recognition
- John Murphy's Market Message
- MurphyExplainsMarketAnalysis-Intermarket Analysis
- MurphyExplainsMarketAnalysis-Visual Analysis
- StockCharts.com
- Technical Analysis of the Financial Markets
- The Visual Investor
- VectorVest, Inc.
- Executive Premier Workshop
- One-Day Options Course
- OptionsPro
- Retirement Income Workshop
- Sure-Fire Trading Systems (VectorVest, Inc.)
- Trading as a Business Workshop
- VectorVest 7 EOD
- VectorVest 7 RealTime/IntraDay
- VectorVest AutoTester
- VectorVest Educational Services
- VectorVest OnLine
- VectorVest Options Analyzer
- VectorVest ProGraphics v6.0
- VectorVest ProTrader 7
- VectorVest RealTime Derby Tool
- VectorVest Simulator
- VectorVest Variator
- VectorVest Watchdog
