HOT TOPICS LIST
- MACD
- Fibonacci
- RSI
- Gann
- ADXR
- Stochastics
- Volume
- Triangles
- Futures
- Cycles
- Volatility
- ZIGZAG
- MESA
- Retracement
- Aroon
INDICATORS LIST
LIST OF TOPICS
PRINT THIS ARTICLE
by David Penn
A bearish triangle threatens reversals for the Dow Jones Transportation Average.
Position: N/A
David Penn
Technical Writer for Technical Analysis of STOCKS & COMMODITIES magazine, Working-Money.com, and Traders.com Advantage.
PRINT THIS ARTICLE
BROAD FORMATION
Planes, Trains and Right-angled Ascending Broadening Formations
12/29/00 03:10:37 PMby David Penn
A bearish triangle threatens reversals for the Dow Jones Transportation Average.
Position: N/A
| Is a pattern with a likely profit potential of 10% or less worth trading? If a bearish chart pattern appeared, and the measure rule for that formation suggested a decline from 2700 to 2550, would you even bother to pursue it further? These are some of the questions that came up when I noted the megaphone-like formation in the Dow Jones Transportation Average over the past two months. This formation, with a flat, horizontal bottom and a series of higher highs along an up-sloping trend line, is known as a right-angled broadening formation. Because the pattern is registering higher highs, it is referred to as an ascending broadening formation. But often "ascending" is a bit of a misnomer. Right-angled ascending broadening formations are bearish beasts. |
| Before taking a close look at the pattern developing in the DJTA, there is more to be said about right-angled ascending broadening formations. Unlike other chart patterns, right-angled ascending broadening formations (my kingdom for an abbreviation!) have an irregular volume trend during the development of the formation--though a volume surge on the breakout is typical. While premature breakouts (upside or downside) tend to be rare, pullbakcs to the horizontal trend line are fairly common. Also common are "partial rises" during which prices move toward, but do not meet, the up-sloping trend line. These "partial rises" can be signals for a coming breakout, particularly on the downside. |

|
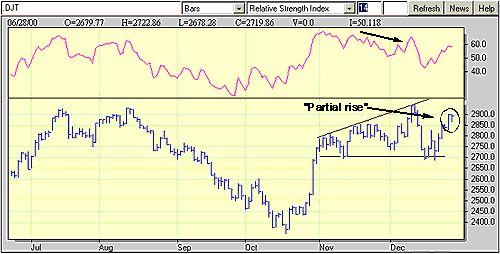
| Stiff support at 2700 and higher highs in November and December set up this right-angled, ascending broadening formation. The declining relative strength further suggests a bearish retreat for the DJTA. |
| Graphic provided by: MetaStock. |
| |
| Many of these characteristics are very much in evidence with the right-angled ascending broadening formation in the DJTA. The series of higher highs is present--the up-sloping trend line connecting the highs of November with those of December. Also noteworthy is the steadfastness of the horizontal trendline, which is scarcely penetrated during the pattern's development over the past two months. The "partial rise" phenonmenon also appears to be in effect, as the mid-December rally looks to have topped out at 2900. |
| Perhaps one of the reasons why it is suggested that this formation is potentially less profitable has to do with waiting for the downside breakout. In the present chart, a downside breakout would mean penetration of the horizontal line at 2700. The measure rule for right-angled, ascending broadening formations is somewhat commonsensical: measure the distance from the highest high in the formation to the horizontal line at the bottom of the formation, and subtract that value from the horizontal line's value. In this case, our formation's high is at about 3000, with the horizontal line at 2700. This would give us a formation size of 300 and a likely decline to as low as 2400. |
| Some (including Bulkowski) suggest halving the formation size before subtracting it from the horizontal line's value, which in this instance would reduce the likely decline from 2400 to 2550. This, too, lowers the decline from about 11% to 5%--measured from the point of breakout to the low. Whether this is a significant enough move to warrant further investigation into the DJTA components in search of weakness may be debatable. But there are certainly some technically weak stocks in the DJTA (along with some strong ones) whose weakness may be exposed during a drop in the DJTA. Some of these stocks include: Alexander & Baldwin (ALEX), CSX Corporation (CSX), and Norfolk Southern (NSC). |
Technical Writer for Technical Analysis of STOCKS & COMMODITIES magazine, Working-Money.com, and Traders.com Advantage.
| Title: | Technical Writer |
| Company: | Technical Analysis, Inc. |
| Address: | 4757 California Avenue SW |
| Seattle, WA 98116 | |
| Phone # for sales: | 206 938 0570 |
| Fax: | 206 938 1307 |
| Website: | www.Traders.com |
| E-mail address: | DPenn@traders.com |
Traders' Resource Links | |
| Charting the Stock Market: The Wyckoff Method -- Books | |
| Working-Money.com -- Online Trading Services | |
| Traders.com Advantage -- Online Trading Services | |
| Technical Analysis of Stocks & Commodities -- Publications and Newsletters | |
| Working Money, at Working-Money.com -- Publications and Newsletters | |
| Traders.com Advantage -- Publications and Newsletters | |
| Professional Traders Starter Kit -- Software | |
Click here for more information about our publications!
Comments
Date: / /Rank: 4Comment:

Request Information From Our Sponsors
- StockCharts.com, Inc.
- Candle Patterns
- Candlestick Charting Explained
- Intermarket Technical Analysis
- John Murphy on Chart Analysis
- John Murphy's Chart Pattern Recognition
- John Murphy's Market Message
- MurphyExplainsMarketAnalysis-Intermarket Analysis
- MurphyExplainsMarketAnalysis-Visual Analysis
- StockCharts.com
- Technical Analysis of the Financial Markets
- The Visual Investor
- VectorVest, Inc.
- Executive Premier Workshop
- One-Day Options Course
- OptionsPro
- Retirement Income Workshop
- Sure-Fire Trading Systems (VectorVest, Inc.)
- Trading as a Business Workshop
- VectorVest 7 EOD
- VectorVest 7 RealTime/IntraDay
- VectorVest AutoTester
- VectorVest Educational Services
- VectorVest OnLine
- VectorVest Options Analyzer
- VectorVest ProGraphics v6.0
- VectorVest ProTrader 7
- VectorVest RealTime Derby Tool
- VectorVest Simulator
- VectorVest Variator
- VectorVest Watchdog
