HOT TOPICS LIST
- MACD
- Fibonacci
- RSI
- Gann
- ADXR
- Stochastics
- Volume
- Triangles
- Futures
- Cycles
- Volatility
- ZIGZAG
- MESA
- Retracement
- Aroon
INDICATORS LIST
LIST OF TOPICS
PRINT THIS ARTICLE
by David Penn
A failed breakout sets up a diamond consolidation in the Dow transports.
Position: N/A
David Penn
Technical Writer for Technical Analysis of STOCKS & COMMODITIES magazine, Working-Money.com, and Traders.com Advantage.
PRINT THIS ARTICLE
THE DIAMOND
Cup With Handle Becomes Diamond
07/16/07 03:22:34 PMby David Penn
A failed breakout sets up a diamond consolidation in the Dow transports.
Position: N/A
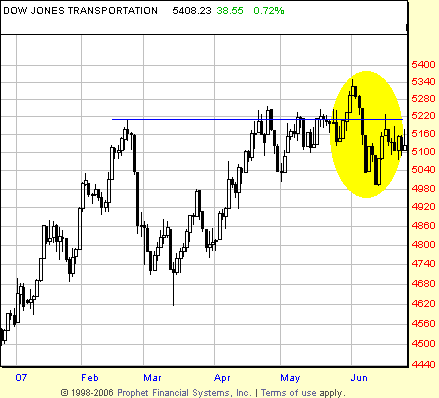
| Back in late May, I wrote an article for Traders.com Advantage that suggested that a large cup with handle pattern in the Dow transports was a bullish sign for the group — and perhaps for stocks in general ("A Cup With Handle In Transports," May 31, 2007). The transports indeed broke out of a consolidation range in late May. However, sellers quickly overwhelmed the breakout, sending the market tumbling back into the consolidation range by mid-June. See Figure 1. |
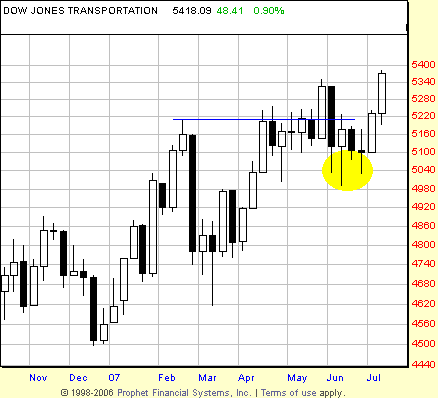
| But the weekly chart reflected underlying weakness on the part of the sellers when it came to pushing the market lower, rather than merely stopping the move higher on the first attempt (Figure 2). Weekly candlestick lines in the first half of June featured long lower shadows, suggesting an inability on the part of sellers to close the market at or near the lows given key opportunities. These opportunities revealed themselves in the first, second, and third weeks of June, yet buyers, who had been beaten on the breakout, stepped up to prevent the market from breaking down. |

|
| FIGURE 1: DOW JONES TRANSPORTATION AVERAGE, DAILY. The breakout from the cup with handle pattern failed in the first few days of June. A lower low was created in June vis-ą-vis May, warning of the potential for further weakness going forward. |
| Graphic provided by: Prophet Financial, Inc. |
| |
| This weakness in the weekly candlestick lines helped suggest that while the transports may not have been ready to break out, they were not yet in any mood to break down, either. |

|
| FIGURE 2: DOW JONES TRANSPORTATION AVERAGE, WEEKLY. The long lower shadows on the weekly candlestick lines in June suggest weakness on the part of sellers trying to push the market lower in the wake of the failed breakout in late May. |
| Graphic provided by: Prophet Financial, Inc. |
| |
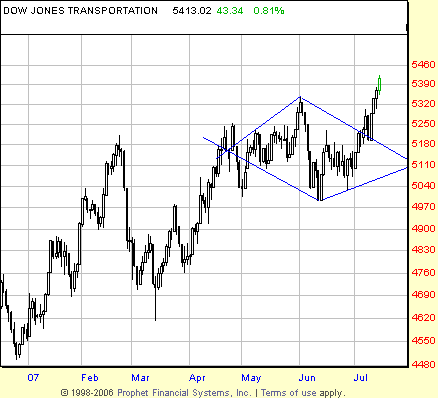
| The failed breakout, pullback, and resumption in the Dow transports invalidated the cup with handle pattern, but it also seemed to create another consolidation pattern: a diamond (Figure 3). Diamond patterns, like their cousins the symmetrical triangle, serve as both continuation and reversal patterns. However, in the context of the previous cup with handle pattern (which was bullish) and the failure of the failed breakout to result in a true reversal (also bullish), technicians had reason to hope if not believe that the diamond in the Dow transports would result in a breakout to the upside. That breakout to the upside did in fact occur. How far might it go? The width of the diamond pattern is approximately 325 points. With a breakout at approximately 5,215, this suggests an upside target near 5,540. |

|
| FIGURE 3: DOW JONES TRANSPORTATION AVERAGE, DAILY. The failed breakout and pullback in the Dow transports contributed toward the development of this diamond pattern. A breakout to the upside in early July led to new all-time highs in the transports by midmonth. |
| Graphic provided by: Prophet Financial, Inc. |
| |
Technical Writer for Technical Analysis of STOCKS & COMMODITIES magazine, Working-Money.com, and Traders.com Advantage.
| Title: | Technical Writer |
| Company: | Technical Analysis, Inc. |
| Address: | 4757 California Avenue SW |
| Seattle, WA 98116 | |
| Phone # for sales: | 206 938 0570 |
| Fax: | 206 938 1307 |
| Website: | www.Traders.com |
| E-mail address: | DPenn@traders.com |
Traders' Resource Links | |
| Charting the Stock Market: The Wyckoff Method -- Books | |
| Working-Money.com -- Online Trading Services | |
| Traders.com Advantage -- Online Trading Services | |
| Technical Analysis of Stocks & Commodities -- Publications and Newsletters | |
| Working Money, at Working-Money.com -- Publications and Newsletters | |
| Traders.com Advantage -- Publications and Newsletters | |
| Professional Traders Starter Kit -- Software | |
Click here for more information about our publications!
Comments
Date: 07/17/07Rank: 5Comment: Good learning tool.nteresting!
Rod Huffman

Request Information From Our Sponsors
- StockCharts.com, Inc.
- Candle Patterns
- Candlestick Charting Explained
- Intermarket Technical Analysis
- John Murphy on Chart Analysis
- John Murphy's Chart Pattern Recognition
- John Murphy's Market Message
- MurphyExplainsMarketAnalysis-Intermarket Analysis
- MurphyExplainsMarketAnalysis-Visual Analysis
- StockCharts.com
- Technical Analysis of the Financial Markets
- The Visual Investor
- VectorVest, Inc.
- Executive Premier Workshop
- One-Day Options Course
- OptionsPro
- Retirement Income Workshop
- Sure-Fire Trading Systems (VectorVest, Inc.)
- Trading as a Business Workshop
- VectorVest 7 EOD
- VectorVest 7 RealTime/IntraDay
- VectorVest AutoTester
- VectorVest Educational Services
- VectorVest OnLine
- VectorVest Options Analyzer
- VectorVest ProGraphics v6.0
- VectorVest ProTrader 7
- VectorVest RealTime Derby Tool
- VectorVest Simulator
- VectorVest Variator
- VectorVest Watchdog
