HOT TOPICS LIST
- MACD
- Fibonacci
- RSI
- Gann
- ADXR
- Stochastics
- Volume
- Triangles
- Futures
- Cycles
- Volatility
- ZIGZAG
- MESA
- Retracement
- Aroon
INDICATORS LIST
LIST OF TOPICS
PRINT THIS ARTICLE
by Koos van der Merwe
I-Flow Corp. triggered a buy on my daily/weekly strategy analysis. Why?
Position: Buy
Koos van der Merwe
Has been a technical analyst since 1969, and has worked as a futures and options trader with First Financial Futures in Johannesburg, South Africa.
PRINT THIS ARTICLE
STRATEGIES
Is I-Flow Corp. Worth A Buy?
07/13/07 12:14:21 PMby Koos van der Merwe
I-Flow Corp. triggered a buy on my daily/weekly strategy analysis. Why?
Position: Buy
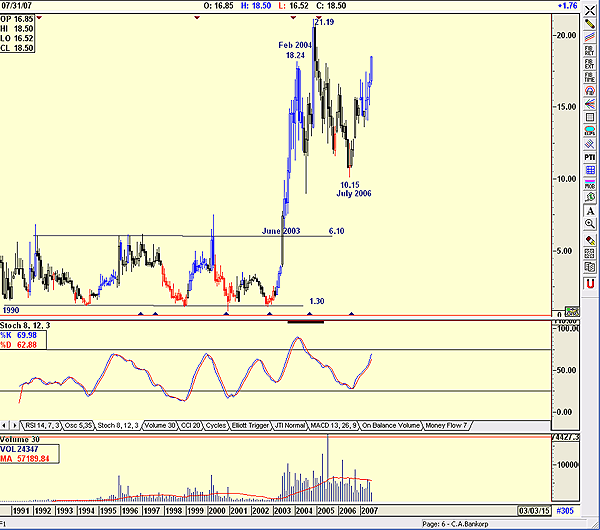
| I-Flow Corp. (IFLO) designs, develops, manufactures, and markets technically advanced, low-cost ambulatory drug delivery systems that seek to redefine the standard of care by providing life-enhancing, cost-effective solutions for pain management and infusion therapy. The company's products are used in hospitals and other settings, including free-standing surgery centers and physicians' offices. Nothing out of the ordinary there, so why the buy signal? A search of recent news also revealed nothing, so the decision to buy the share is based purely on technical analysis. Figure 1 is a monthly chart and shows how the share moved in a trading range of $1.30 to $6.20 from 1991 to June 2003, when it broke above the resistance line and moved to a high of $18.24 by February 2004. It reached a high of $21.19 by November 2004, falling back to a low of $10.15 by July 2006. Is the stock price establishing another trading range? Can we play it? To answer these questions, I looked at the weekly chart (Figure 2). |

|
| FIGURE 1: IFLO, MONTHLY. This chart suggested a trading range |
| Graphic provided by: AdvancedGET. |
| |
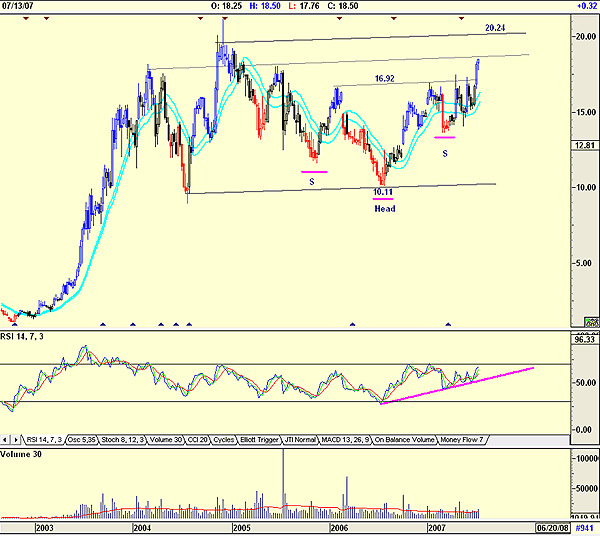
| Figure 2 suggests that another trading range is possibly being established between $10.11 and $20.24. I have shown what could be an inverse head & shoulder pattern suggesting a target of $23.74 (16.92 - 10.11 = 6.81 + 16.92 = 23.73). With the current price at $18.50, there could be 10% plus profit potential. The relative strength index (RSI) is bullish, and volume is above average. |

|
| FIGURE 2: IFLO, WEEKLY. This chart confirmed a trading range and showed a possible inverted head & shoulder pattern. |
| Graphic provided by: AdvancedGET. |
| |
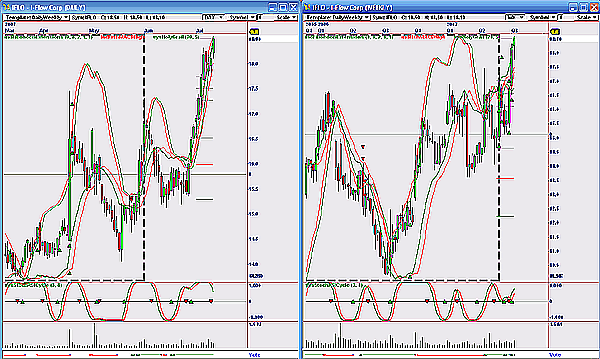
| Finally, I looked at the daily/weekly chart that highlighted the buy signal. Figure 3 is an OmniTrader daily and weekly chart. Note that the daily chart gave a buy signal on June 18, with the weekly chart first giving a buy signal in April, with confirming signals triggered over the following few weeks. In the daily chart, the stochastic RSI is suggesting weakness ahead, whereas the stochRSI on the weekly chart is still positive. The two indicators superimposed on the chart itself are the Fisher transform of the moving average convergence/divergence (MACD) high, which is positive in both charts, and the "holy grail indicator," also positive. Both formulas are available on request. |

|
| FIGURE 3: OMNITRADER, DAILY/WEEKLY. This chart shows a voting pattern. |
| Graphic provided by: OMNITRADER. |
| |
| The vote pattern that triggered the buy signal can be seen in Figure 4. The chart is a copy of the focus list that analyzes that chart pattern. I have highlighted IFLO in blue. My parameters of choice are that FTHR (forward test hit rate) must be 100 and the ADV (advisor) must be over 70. IFLO met these parameters, which brought it to my attention. Note too that the strategy that triggered the buy signal was the stochastic RSI signal. The backtesting % profitability (BTProf%) suggested is 11% and the forward test profitability (FTProf%) is 9%. The stock is definitely worth looking at with a buy on the bid at any pullback. |

|
| FIGURE 4: VOTING SIGNAL. This voting signal triggered a buy of IFLO. |
| Graphic provided by: Omnitrader. |
| |
Has been a technical analyst since 1969, and has worked as a futures and options trader with First Financial Futures in Johannesburg, South Africa.
| Address: | 3256 West 24th Ave |
| Vancouver, BC | |
| Phone # for sales: | 6042634214 |
| E-mail address: | petroosp@gmail.com |
Click here for more information about our publications!
PRINT THIS ARTICLE

Request Information From Our Sponsors
- StockCharts.com, Inc.
- Candle Patterns
- Candlestick Charting Explained
- Intermarket Technical Analysis
- John Murphy on Chart Analysis
- John Murphy's Chart Pattern Recognition
- John Murphy's Market Message
- MurphyExplainsMarketAnalysis-Intermarket Analysis
- MurphyExplainsMarketAnalysis-Visual Analysis
- StockCharts.com
- Technical Analysis of the Financial Markets
- The Visual Investor
- VectorVest, Inc.
- Executive Premier Workshop
- One-Day Options Course
- OptionsPro
- Retirement Income Workshop
- Sure-Fire Trading Systems (VectorVest, Inc.)
- Trading as a Business Workshop
- VectorVest 7 EOD
- VectorVest 7 RealTime/IntraDay
- VectorVest AutoTester
- VectorVest Educational Services
- VectorVest OnLine
- VectorVest Options Analyzer
- VectorVest ProGraphics v6.0
- VectorVest ProTrader 7
- VectorVest RealTime Derby Tool
- VectorVest Simulator
- VectorVest Variator
- VectorVest Watchdog
