HOT TOPICS LIST
- MACD
- Fibonacci
- RSI
- Gann
- ADXR
- Stochastics
- Volume
- Triangles
- Futures
- Cycles
- Volatility
- ZIGZAG
- MESA
- Retracement
- Aroon
INDICATORS LIST
LIST OF TOPICS
PRINT THIS ARTICLE
by David Penn
A classic bearish reversal pattern in the second half of June put an end to the rally in the September greenback.
Position: N/A
David Penn
Technical Writer for Technical Analysis of STOCKS & COMMODITIES magazine, Working-Money.com, and Traders.com Advantage.
PRINT THIS ARTICLE
CANDLESTICK CHARTING
Dollar Dark Cloud Cover
07/13/07 01:16:41 PMby David Penn
A classic bearish reversal pattern in the second half of June put an end to the rally in the September greenback.
Position: N/A
| You will find few technicians who have been as desperate for a bottom in the dollar than yours truly. And, if truth be told, I still think there is as much a chance of the dollar making a bear market rally (especially if interest rates rise) as there is of the dollar collapsing. But you have to know when to fold 'em, and for dollar bulls — a battered lot, to be sure — folding time came in the second half of June. |
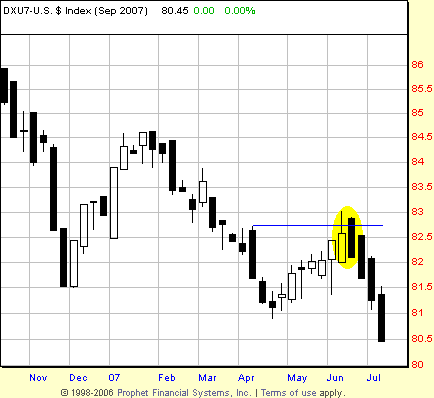
| The spring rally in the dollar brought the market from 81 to 82.5 (basis September) from the low in late April to the high in mid-June. In doing so, the dollar retraced just over 50% of its decline from the year-to-date highs in January near 84.5. In mid-June, the dollar was nearing a source of potential resistance just north of 82.5, resistance left over from a short-term bounce in late March. |
| The market opened up well above the resistance level, suggesting initially that buyers were ready to take the market higher. But sellers immediately overwhelmed the market, driving it lower by the close to the point where the lows of the previous day were almost taken out. |

|
| FIGURE 1: US DOLLAR INDEX, SEPTEMBER FUTURES, WEEKLY. The follow-through to the downside helps turn this dark cloud cover pattern in the second half of June into a true reversal pattern. |
| Graphic provided by: Prophet Financial, Inc. |
| |
| This reaction on the part of sellers created what Japanese candlestick chartists call "dark cloud cover" (Figure 1). When, in a rally, a market opens higher but then closes lower, penetrating the range of the previous day by 50% or more, that market is called "dark cloud cover." It suggests that the momentum to the upside has been exhausted, and that the market is increasingly vulnerable to reversal. The key is vulnerable to reversal. The only guarantee with dark cloud cover is that upside momentum has stalled. Only when the market in fact reverses, closing below the low of the dark cloud cover pattern, is the reversal confirmed and the market safe for selling. |
| By "dark cloud cover pattern," I mean both the "dark cloud" candlestick and the candlestick that is being "overshadowed." The dark cloud cover developed in the September dollar as of the third week of June. That was the warning to the bulls. The fourth week of June represented confirmation for those looking to sell the dollar that the seven-week bounce from mid-April was over. Two weeks later, the dollar broke down to new lows on a weekly closing basis. |
Technical Writer for Technical Analysis of STOCKS & COMMODITIES magazine, Working-Money.com, and Traders.com Advantage.
| Title: | Technical Writer |
| Company: | Technical Analysis, Inc. |
| Address: | 4757 California Avenue SW |
| Seattle, WA 98116 | |
| Phone # for sales: | 206 938 0570 |
| Fax: | 206 938 1307 |
| Website: | www.Traders.com |
| E-mail address: | DPenn@traders.com |
Traders' Resource Links | |
| Charting the Stock Market: The Wyckoff Method -- Books | |
| Working-Money.com -- Online Trading Services | |
| Traders.com Advantage -- Online Trading Services | |
| Technical Analysis of Stocks & Commodities -- Publications and Newsletters | |
| Working Money, at Working-Money.com -- Publications and Newsletters | |
| Traders.com Advantage -- Publications and Newsletters | |
| Professional Traders Starter Kit -- Software | |
Click here for more information about our publications!
Comments
Date: 07/17/07Rank: 4Comment:

Request Information From Our Sponsors
- VectorVest, Inc.
- Executive Premier Workshop
- One-Day Options Course
- OptionsPro
- Retirement Income Workshop
- Sure-Fire Trading Systems (VectorVest, Inc.)
- Trading as a Business Workshop
- VectorVest 7 EOD
- VectorVest 7 RealTime/IntraDay
- VectorVest AutoTester
- VectorVest Educational Services
- VectorVest OnLine
- VectorVest Options Analyzer
- VectorVest ProGraphics v6.0
- VectorVest ProTrader 7
- VectorVest RealTime Derby Tool
- VectorVest Simulator
- VectorVest Variator
- VectorVest Watchdog
- StockCharts.com, Inc.
- Candle Patterns
- Candlestick Charting Explained
- Intermarket Technical Analysis
- John Murphy on Chart Analysis
- John Murphy's Chart Pattern Recognition
- John Murphy's Market Message
- MurphyExplainsMarketAnalysis-Intermarket Analysis
- MurphyExplainsMarketAnalysis-Visual Analysis
- StockCharts.com
- Technical Analysis of the Financial Markets
- The Visual Investor
