HOT TOPICS LIST
- MACD
- Fibonacci
- RSI
- Gann
- ADXR
- Stochastics
- Volume
- Triangles
- Futures
- Cycles
- Volatility
- ZIGZAG
- MESA
- Retracement
- Aroon
INDICATORS LIST
LIST OF TOPICS
PRINT THIS ARTICLE
by David Penn
A shift in positive directional movement accompanies a breakout in the Dow Jones industrials.
Position: N/A
David Penn
Technical Writer for Technical Analysis of STOCKS & COMMODITIES magazine, Working-Money.com, and Traders.com Advantage.
PRINT THIS ARTICLE
BREAKOUTS
Breakouts, Directional Movement, And The DJIA
07/13/07 12:19:29 PMby David Penn
A shift in positive directional movement accompanies a breakout in the Dow Jones industrials.
Position: N/A
| I've been suggesting that the current market correction in the Standard & Poor's 500 and Dow Jones Industrial Average (DJIA) is merely a correction in a continuing bull market virtually since the market sold off in early June (see my "A Fourth Wave Correction?" from June 25, 2007; and my "A 2B Test of Bottom in the S&P 500" from July 6, 2007, both in Traders.com Advantage). |
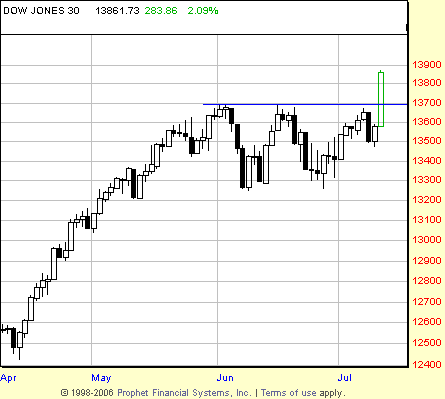
| Today's 280+ point breakout in the DJIA pretty much vindicates those bullish observations (see Figure 1). I thought there was a good chance that the DJIA might move lower one more time to test the lows of the second half of June before breaking out to the upside. But my sense that the next significant move would be upward never wavered. |

|
| FIGURE 1: DOW JONES INDUSTRIAL AVERAGE, DAILY. A major breakout in the first half of July sends the DJIA soaring away from this mildly triangular consolidation. The size of the consolidation range suggests that the 14,000 level will be tested, at a minimum. |
| Graphic provided by: Prophet Financial, Inc. |
| |
| As clear as the breakout is on the price charts sans technical indicators, it is interesting to see how the breakout set up using technical indicators. Of the indicators I follow and use regularly, the bullish M-m-M pattern in the moving average convergence/divergence (MACD) histogram would have provided for the earliest entry (today's close). The BOSO stochastic, which recognized the market as overbought on July 9 and pointed to a long trade as soon as that July 9th high was bested on a closing basis, also would have gotten traders long at the end of today's trading. Two other indicators, the TRIX and DM (directional movement), would have been one day late, with today's close being a signal awaiting confirmation in the form of a follow-through higher close. Nevertheless, I want to look at DM — often used as a trend analysis tool — and the way it helped traders time breakouts most recently as well as during the DJIA's advance over the spring. |

|
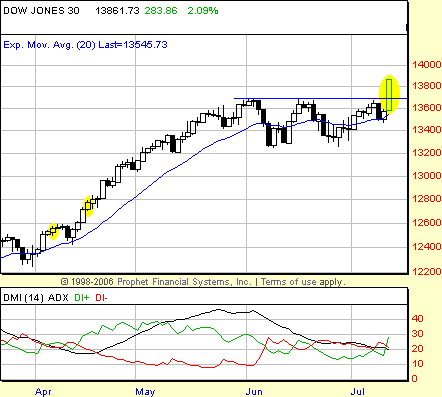
| FIGURE 2: DOW JONES INDUSTRIAL AVERAGE, DAILY. The highlighted candlestick lines in the price chart show confirmed closes after the session during which the bullish DI+ line (green) crossed above the bearish DI- line (red). |
| Graphic provided by: Prophet Financial, Inc. |
| |
| Figure 2 shows the DJIA since the March bottom. Before the June correction, there were a number of instances when the bullish DI+ line crossed above the DI-. However, there were only two instances when this cross was followed by a higher close. A higher close, in this context, is a confirming close, showing that the market took the most recent bullish action as bullish going forward (rather than fading the bullishness of a DI+ cross). Those two instances — both in April — are highlighted in the chart. |
| Again, a confirming close in a bullish context means a close above and beyond the high of the session during which the bullish signal was given. As such, there were a few DI+ crosses that did not result in a buy signal. The one on July 12, however, was not one of them. The breakout in the DJIA was genuine, per directional movement, and now awaits only a confirming close to send the market even higher. |
Technical Writer for Technical Analysis of STOCKS & COMMODITIES magazine, Working-Money.com, and Traders.com Advantage.
| Title: | Technical Writer |
| Company: | Technical Analysis, Inc. |
| Address: | 4757 California Avenue SW |
| Seattle, WA 98116 | |
| Phone # for sales: | 206 938 0570 |
| Fax: | 206 938 1307 |
| Website: | www.Traders.com |
| E-mail address: | DPenn@traders.com |
Traders' Resource Links | |
| Charting the Stock Market: The Wyckoff Method -- Books | |
| Working-Money.com -- Online Trading Services | |
| Traders.com Advantage -- Online Trading Services | |
| Technical Analysis of Stocks & Commodities -- Publications and Newsletters | |
| Working Money, at Working-Money.com -- Publications and Newsletters | |
| Traders.com Advantage -- Publications and Newsletters | |
| Professional Traders Starter Kit -- Software | |
Click here for more information about our publications!
Comments
Date: 07/17/07Rank: 5Comment: Good work! And, good forecasting!
Rod Hufman

Request Information From Our Sponsors
- StockCharts.com, Inc.
- Candle Patterns
- Candlestick Charting Explained
- Intermarket Technical Analysis
- John Murphy on Chart Analysis
- John Murphy's Chart Pattern Recognition
- John Murphy's Market Message
- MurphyExplainsMarketAnalysis-Intermarket Analysis
- MurphyExplainsMarketAnalysis-Visual Analysis
- StockCharts.com
- Technical Analysis of the Financial Markets
- The Visual Investor
- VectorVest, Inc.
- Executive Premier Workshop
- One-Day Options Course
- OptionsPro
- Retirement Income Workshop
- Sure-Fire Trading Systems (VectorVest, Inc.)
- Trading as a Business Workshop
- VectorVest 7 EOD
- VectorVest 7 RealTime/IntraDay
- VectorVest AutoTester
- VectorVest Educational Services
- VectorVest OnLine
- VectorVest Options Analyzer
- VectorVest ProGraphics v6.0
- VectorVest ProTrader 7
- VectorVest RealTime Derby Tool
- VectorVest Simulator
- VectorVest Variator
- VectorVest Watchdog
