HOT TOPICS LIST
- MACD
- Fibonacci
- RSI
- Gann
- ADXR
- Stochastics
- Volume
- Triangles
- Futures
- Cycles
- Volatility
- ZIGZAG
- MESA
- Retracement
- Aroon
INDICATORS LIST
LIST OF TOPICS
PRINT THIS ARTICLE
by Koos van der Merwe
Corriente Resources is a Canadian-based exploration company specializing in copper and copper-gold opportunities, with its main focus being Corriente Copper Belt in Ecuador
Position: Accumulate
Koos van der Merwe
Has been a technical analyst since 1969, and has worked as a futures and options trader with First Financial Futures in Johannesburg, South Africa.
PRINT THIS ARTICLE
ASCENDING TRIANGLES
Has Corriente Resources Solved Its Political Problems?
07/10/07 09:20:09 AMby Koos van der Merwe
Corriente Resources is a Canadian-based exploration company specializing in copper and copper-gold opportunities, with its main focus being Corriente Copper Belt in Ecuador
Position: Accumulate
| Corriente Resources recently announced that its Panantza project in the Corriente Copper Belt in southeast Ecuador is now estimated at 463 million tons, an increase of almost a billion pounds of copper. This sounds good, especially if Corriente has solved its political problems with Ecuadorian environmentalists, who tend to handicap foreign-owned mining in the country. The company has been around for a long time, with prices in March 1997 reaching a high of $19.50. From that high, prices steadily dropped to a low of $0.45 by August 1998, well before the 2000 bubble as the company was handicapped by political problems rather than mining problems. |

|
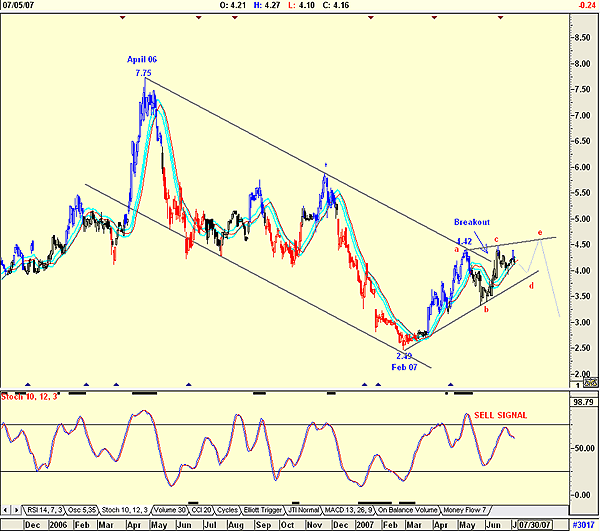
| FIGURE 1: CORRIENTE. This shows the rising pennant and probable trend. |
| Graphic provided by: AdvancedGET. |
| |
| Figure 1, a daily chart, shows how the price fell from $7.75 in April 2006 to the low of $2.49 by February 2007. From this level it has moved to form what could be a rising wedge starting at $4.42. Rising wedges are short-term bullish but long-term bearish, because they rise in an a-b-c-d-e pattern before breaking down. There's not much in it for investors, but it is interesting to traders. The stochastic indicator (10,12,3) shown has given a sell signal, so why am I recommending the share as a short-term buy? Here, we must look at Figure 2. |

|
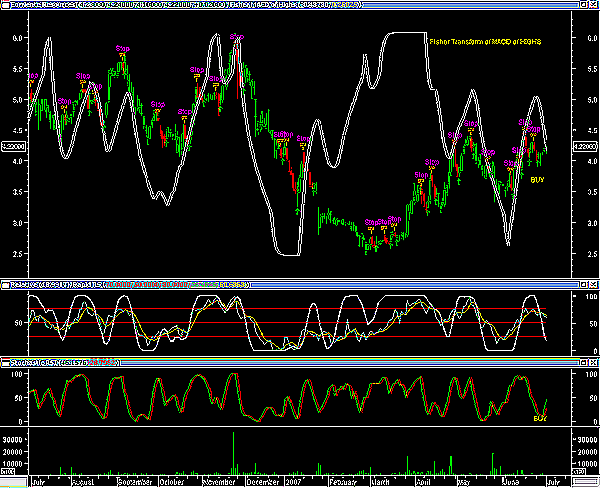
| FIGURE 2: CORRIENTE. This chart shows the indicators suggesting a buy. |
| Graphic provided by: MetaStock. |
| |
| Figure 2 shows the indicators I use when I look at a stock: a. The first pane in Figure 2 is a candlestick chart showing the buy & stop signals highlighted by the Expert Advisor pattern trading system. I have modified the strategy to show the sell signals as stops. b. The Fisher transform of the MACD of the high. This conservative indicator is still bearish. c. Relative strength spread. Like the Fisher MACD of the highs, this indicator is also bearish, but its value is 18.99, suggesting that it could soon be near a turning point at zero. d. Rapid RSI. At 61.69 it has not reached oversold levels and could still be bullish. e. Stochastic RSI. This indicator triggered a buy signal. f. Volume has been extremely low, suggesting there are not many buyers or sellers at present. Investors appear to be holding their shares. |
| The buy signal by the stochastic RSI brought this stock to my attention. I will be watching it closely, looking for a buying opportunity as and when it completes 'd' on my top chart. This gives a good short-term trading opportunity for the risk-inclined trader. |
Has been a technical analyst since 1969, and has worked as a futures and options trader with First Financial Futures in Johannesburg, South Africa.
| Address: | 3256 West 24th Ave |
| Vancouver, BC | |
| Phone # for sales: | 6042634214 |
| E-mail address: | petroosp@gmail.com |
Click here for more information about our publications!
PRINT THIS ARTICLE

Request Information From Our Sponsors
- StockCharts.com, Inc.
- Candle Patterns
- Candlestick Charting Explained
- Intermarket Technical Analysis
- John Murphy on Chart Analysis
- John Murphy's Chart Pattern Recognition
- John Murphy's Market Message
- MurphyExplainsMarketAnalysis-Intermarket Analysis
- MurphyExplainsMarketAnalysis-Visual Analysis
- StockCharts.com
- Technical Analysis of the Financial Markets
- The Visual Investor
- VectorVest, Inc.
- Executive Premier Workshop
- One-Day Options Course
- OptionsPro
- Retirement Income Workshop
- Sure-Fire Trading Systems (VectorVest, Inc.)
- Trading as a Business Workshop
- VectorVest 7 EOD
- VectorVest 7 RealTime/IntraDay
- VectorVest AutoTester
- VectorVest Educational Services
- VectorVest OnLine
- VectorVest Options Analyzer
- VectorVest ProGraphics v6.0
- VectorVest ProTrader 7
- VectorVest RealTime Derby Tool
- VectorVest Simulator
- VectorVest Variator
- VectorVest Watchdog
