HOT TOPICS LIST
- MACD
- Fibonacci
- RSI
- Gann
- ADXR
- Stochastics
- Volume
- Triangles
- Futures
- Cycles
- Volatility
- ZIGZAG
- MESA
- Retracement
- Aroon
INDICATORS LIST
LIST OF TOPICS
PRINT THIS ARTICLE
by Chaitali Mohile
China Finance Online Co. Ltd. is likely to break out of a long consolidation range.
Position: Buy
Chaitali Mohile
Active trader in the Indian stock markets since 2003 and a full-time writer. Trading is largely based upon technical analysis.
PRINT THIS ARTICLE
BREAKOUTS
JRJC Stands On Toes To Break Out
07/12/07 01:26:25 PMby Chaitali Mohile
China Finance Online Co. Ltd. is likely to break out of a long consolidation range.
Position: Buy
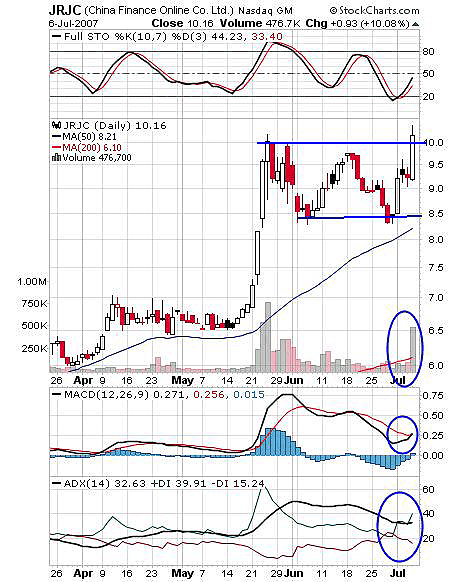
| A security or stock accumulates strength for a further rally while consolidating. Any stock in a downtrend or uptrend undergoes consolidation after a substantial one-sided rally. Consolidation in any direction is healthier for the stock. China Finance Online Co. Ltd. (JRJC), after rallying with a $3 jump, is undergoing a sideways consolidation for about a month now in the range of $8.5–$10. The trading volume during this phase was diminishing. |

|
| FIGURE 1: JRJC, DAILY. The stock is about to break out of consolidation. |
| Graphic provided by: StockCharts.com. |
| |
| Stochastic (10, 7, 3) has started its upward move and indicates enough space for a forthcoming bullish move. While consolidating, lower tops and lower bottoms were formed by stochastics and the price moved accordingly. Meanwhile, the moving average convergence/divergence (MACD) (12, 26, 9) is also trying to move ahead of its trigger line with a bullish crossover. The average directional movement index (ADX) (14) is indicating a strong developed uptrend. |
| In the daily chart seen in Figure 1, JRJC has made new highs on higher volume. This breakout is supported by a positive indicator. You can measure the target level for the breakout by measuring the size of consolidation — that is, 1.5 (10 upper resistances - 8.5 lower support). By adding 1.5 to the breakout level at about 10.20, traders can see the target of 11.70. |

|
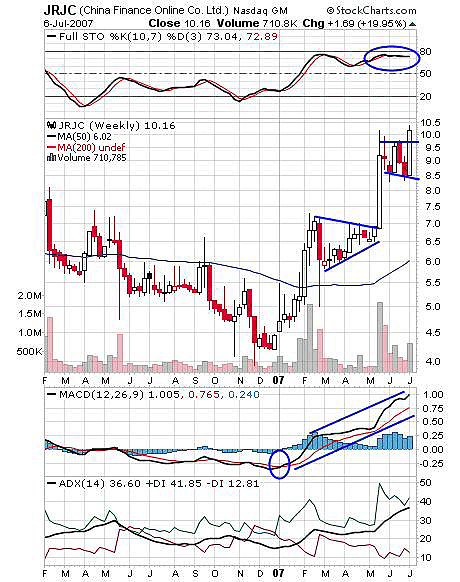
| FIGURE 2: JRJC, WEEKLY. The flag & pennant formation is also ready to break out and continue its previous bullish rally. |
| Graphic provided by: StockCharts.com. |
| |
| The weekly chart (Figure 2) has two continuation patterns: first, the symmetrical triangle, and second, the pennant. The breakout of a symmetrical triangle gave birth to an upward rally, which gained $3. This rally consolidated near $10, forming a pennant formation. The stock is on edge to break out of this formation and continues its upward rally. Stochastic (10, 7, 3) is moving flat, indicating consolidation, while the MACD (12, 26, 9) remained positive after a bullish crossover in January 2007. The ADX (14) also indicates a strong uptrend. The target on breakout in a weekly time frame can be measured by the size of the flagpole. So by adding 3 (10 - 7) to the breakout level of 10.20, we get a target of approximately $13. |
| Based on the daily chart the consolidation breakout can be bought first with the target of $11.70. The breakout is likely to be on heavy volume, as all the indicators in both charts are positive and indicate a bullish rally. |
Active trader in the Indian stock markets since 2003 and a full-time writer. Trading is largely based upon technical analysis.
| Company: | Independent |
| Address: | C1/3 Parth Indraprasth Towers. Vastrapur |
| Ahmedabad, Guj 380015 | |
| E-mail address: | chaitalimohile@yahoo.co.in |
Traders' Resource Links | |
| Independent has not added any product or service information to TRADERS' RESOURCE. | |
Click here for more information about our publications!
PRINT THIS ARTICLE

Request Information From Our Sponsors
- StockCharts.com, Inc.
- Candle Patterns
- Candlestick Charting Explained
- Intermarket Technical Analysis
- John Murphy on Chart Analysis
- John Murphy's Chart Pattern Recognition
- John Murphy's Market Message
- MurphyExplainsMarketAnalysis-Intermarket Analysis
- MurphyExplainsMarketAnalysis-Visual Analysis
- StockCharts.com
- Technical Analysis of the Financial Markets
- The Visual Investor
- VectorVest, Inc.
- Executive Premier Workshop
- One-Day Options Course
- OptionsPro
- Retirement Income Workshop
- Sure-Fire Trading Systems (VectorVest, Inc.)
- Trading as a Business Workshop
- VectorVest 7 EOD
- VectorVest 7 RealTime/IntraDay
- VectorVest AutoTester
- VectorVest Educational Services
- VectorVest OnLine
- VectorVest Options Analyzer
- VectorVest ProGraphics v6.0
- VectorVest ProTrader 7
- VectorVest RealTime Derby Tool
- VectorVest Simulator
- VectorVest Variator
- VectorVest Watchdog
