HOT TOPICS LIST
- MACD
- Fibonacci
- RSI
- Gann
- ADXR
- Stochastics
- Volume
- Triangles
- Futures
- Cycles
- Volatility
- ZIGZAG
- MESA
- Retracement
- Aroon
INDICATORS LIST
LIST OF TOPICS
PRINT THIS ARTICLE
by Chaitali Mohile
IWP is at a crucial resistance level, and only price action can tell whether these iShares will move ahead or form a triple top.
Position: Hold
Chaitali Mohile
Active trader in the Indian stock markets since 2003 and a full-time writer. Trading is largely based upon technical analysis.
PRINT THIS ARTICLE
TRITOP/TRI BOTTOM
Will IWP Continue Its Bullish Rally?
07/12/07 01:22:31 PMby Chaitali Mohile
IWP is at a crucial resistance level, and only price action can tell whether these iShares will move ahead or form a triple top.
Position: Hold
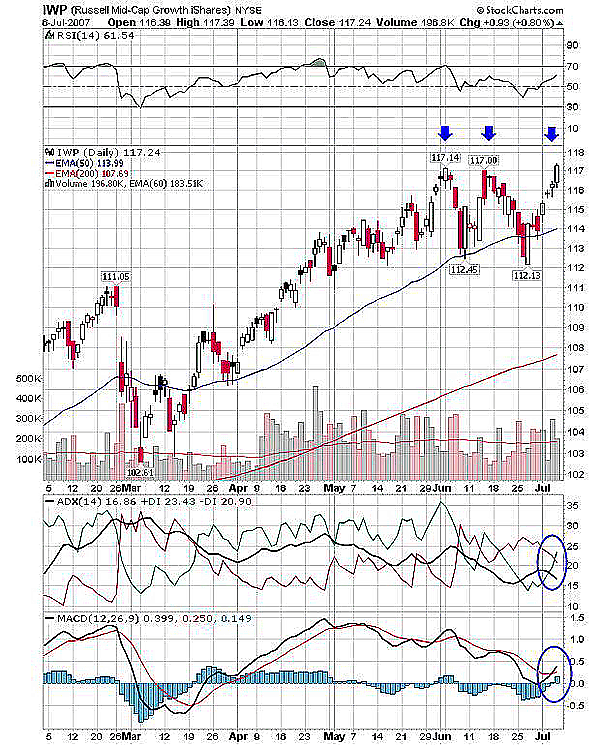
| The 117 level has been a strong resistance point for IWP (Russell Mid-Cap Growth iShares). The stock had retraced twice from the same level, forming the double top. After the first dip the stock rallied toward its high pivot with the 50-day exponential moving average (EMA) as support. Prices retraced again to the same support. The history of the stock from the daily chart (Figure 1) shows that IWP has obeyed the 50-day EMA support. At the end of June 2007, the stock consolidated in its 114-115 range with the 50-day EMA as support. This consolidation range was violated as the RSI (14) moved above 50 and the MACD (12, 26, 9) had a bullish crossover. IWP rallied toward its double-top resistance after a breakout of a sideways move. |

|
| FIGURE 1: IWP, DAILY. IWP stands on a crucial level to decide if the triple top will be formed or continue the bullish rally. |
| Graphic provided by: StockCharts.com. |
| |
| The 117 resistance level was hit three times within a month. This may cause confusion among traders if a triple top is being formed or if the stock continues to rally further. The triple top is a bearish reversal pattern, and all tops are formed almost at the same level. Volume is important in a triple top formation. Volume usually falls as the stock heads toward its high for the third time. In Figure 1, the volume on an advance rally toward the high pivot has lessened, compared to the session of July 5. |
| I would recommend traders hold their long position with a tight stop-loss at 116 and carry the trade. Previously, the price rested at 116, so this level is likely to offer some support ahead of a further fall in a current rally if a triple top is formed. Again, the lowest support would be at the 50-day EMA for this rally. The ADX (14) at the present level is not indicating any particular trend, but the RSI (14) and the MACD (12, 26, 9 ) are much more bullish, so they may strengthen the advance rally. The only way to trade this confusing pattern is by following a stop-loss. |

|
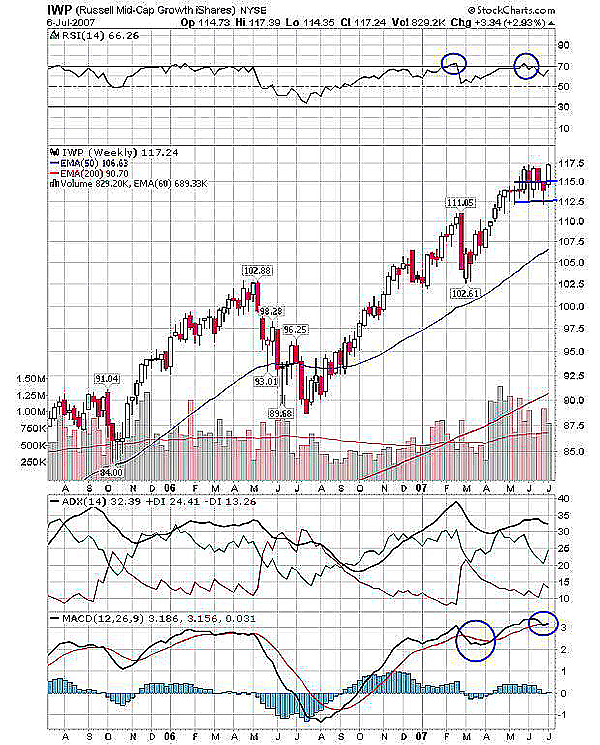
| FIGURE 2: IWP, WEEKLY. The flag & pennant continuation pattern is formed. If the price breaks out of this formation, a new bullish rally can be expected. |
| Graphic provided by: StockCharts.com. |
| |
| The weekly chart (Figure 2) is showing a short-term flag & pennant formation beginning from the 102 level. The flag has two upper resistances, first at 115 and another at 117. The first resistance was turned into support and the price rallied to 117 but could not sustain the new highs. This created a new resistance for its bullish rally. Thus, a breakout from 117 would give a strong bullish rally. The RSI (14) has moved to an overbought level at 66, indicating a bullish strength in a bullish rally. The MACD (12, 26 , 9) is close to its trigger line support. The ADX (14) indicates a well-developed bullish trend at 32. So when price breaks out above 117 you can enter a trade with the target of 130 (115 - 102 = 13). So by adding 13, we get the said target. But traders should remember 130 is a short target, so it might take few months to achieve. |
| With strong indicators on charts it looks the bullish rally is likely to continue. But in such indecisive conditions, following a stop-loss would be to your benefit. The possibility of a triple top cannot be ignored. |
Active trader in the Indian stock markets since 2003 and a full-time writer. Trading is largely based upon technical analysis.
| Company: | Independent |
| Address: | C1/3 Parth Indraprasth Towers. Vastrapur |
| Ahmedabad, Guj 380015 | |
| E-mail address: | chaitalimohile@yahoo.co.in |
Traders' Resource Links | |
| Independent has not added any product or service information to TRADERS' RESOURCE. | |
Click here for more information about our publications!
PRINT THIS ARTICLE

Request Information From Our Sponsors
- VectorVest, Inc.
- Executive Premier Workshop
- One-Day Options Course
- OptionsPro
- Retirement Income Workshop
- Sure-Fire Trading Systems (VectorVest, Inc.)
- Trading as a Business Workshop
- VectorVest 7 EOD
- VectorVest 7 RealTime/IntraDay
- VectorVest AutoTester
- VectorVest Educational Services
- VectorVest OnLine
- VectorVest Options Analyzer
- VectorVest ProGraphics v6.0
- VectorVest ProTrader 7
- VectorVest RealTime Derby Tool
- VectorVest Simulator
- VectorVest Variator
- VectorVest Watchdog
- StockCharts.com, Inc.
- Candle Patterns
- Candlestick Charting Explained
- Intermarket Technical Analysis
- John Murphy on Chart Analysis
- John Murphy's Chart Pattern Recognition
- John Murphy's Market Message
- MurphyExplainsMarketAnalysis-Intermarket Analysis
- MurphyExplainsMarketAnalysis-Visual Analysis
- StockCharts.com
- Technical Analysis of the Financial Markets
- The Visual Investor
