

HOT TOPICS LIST
- MACD
- Fibonacci
- RSI
- Gann
- ADXR
- Stochastics
- Volume
- Triangles
- Futures
- Cycles
- Volatility
- ZIGZAG
- MESA
- Retracement
- Aroon
INDICATORS LIST
LIST OF TOPICS
PRINT THIS ARTICLE
by David Penn
Long on the outside looking in, shares of Caterpillar are rallying from 52-week lows.
Position: N/A
David Penn
Technical Writer for Technical Analysis of STOCKS & COMMODITIES magazine, Working-Money.com, and Traders.com Advantage.
PRINT THIS ARTICLE
MONEY FLOW INDEX
Caterpillar: Earth Moving and Money Flow
12/29/00 09:17:16 AMby David Penn
Long on the outside looking in, shares of Caterpillar are rallying from 52-week lows.
Position: N/A
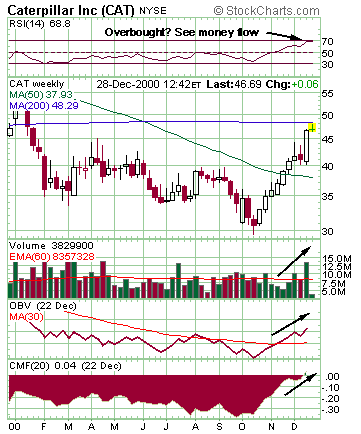
| Caterpillar's stock has been in a bear market since the spring of 1999, when shares reached a peak of about 65. While CAT is still 28% off this peak, trading around 46 currently, shares have made a fierce climb from year-to-date lows around 30. If the shifts in money flow and on-balance volume are as significant as they appear, then CAT could be poised for even further advances. |
| There is little promising in CAT's price action alone--except for the rally, which has continued almost uninterrupted since the year-to-date low in October. Caterpillar shares continue to trade beneath a flattened 200-day moving average, and the year-to-date low of 30 is very recent history. However, CAT did cross over its 50-day moving average during its autumn rally (admittedly, a downwardly trending 50-day moving average) and the fact that the rally continued beyond the crossover point suggests that some welcome flattening will come to the 50-day moving average as well. |
|
| Down, but not out. Shares of Caterpillar move upside of the stock's 50-day moving average as they rally from year-to-date lows. |
| Graphic provided by: Stockcharts.com. |
| |
| Looking at the money flow indicator, however, CAT seems to be a case in which so much money had been leaving the stock that a vacuum was created that is only now starting to draw money back in. The October-December rally in Caterpillar is joined by a major reversal in the flow of funds back into the stock. While bigger, individual down-volume weeks were recorded in the early part of the year, selling reached an extreme in late September and early October. The Chaikin Money Flow oscillator (CMF) uses not only volume but also accumulation/distribution values (calculated from the accumulation/distribution line). This makes the oscillator especially effective in determining the degree or intensity of buying or selling that is occurring. |
| On-balance volume (OBV), which makes a somewhat less sharp distinction between buying and selling volume compared to the CMF, is nevertheless supportive of the CAT rally. Breaking out over a 30-day moving average of on-balance volume in November, OBV successfully tested the 30-day moving average line in early December. On-balance volume is also at a level not seen since the beginning of the year, which bodes well for any continued advance on the part of CAT. |
| The relative strength reading is starting to suggest that CAT may be overbought, which is reason for some caution. But guard against putting too much emphasis on the RSI's near-70 overbought reading. The highs in RSI are responding most likely to the relentless character of CAT's advance (the white bodies of the candlesticks in the chart during the autumn rally suggest as much). One glance at the extreme selling revealed in the money flow oscillator should also help put fears of an overbought CAT to rest. |
Technical Writer for Technical Analysis of STOCKS & COMMODITIES magazine, Working-Money.com, and Traders.com Advantage.
| Title: | Technical Writer |
| Company: | Technical Analysis, Inc. |
| Address: | 4757 California Avenue SW |
| Seattle, WA 98116 | |
| Phone # for sales: | 206 938 0570 |
| Fax: | 206 938 1307 |
| Website: | www.Traders.com |
| E-mail address: | DPenn@traders.com |
Traders' Resource Links | |
| Charting the Stock Market: The Wyckoff Method -- Books | |
| Working-Money.com -- Online Trading Services | |
| Traders.com Advantage -- Online Trading Services | |
| Technical Analysis of Stocks & Commodities -- Publications and Newsletters | |
| Working Money, at Working-Money.com -- Publications and Newsletters | |
| Traders.com Advantage -- Publications and Newsletters | |
| Professional Traders Starter Kit -- Software | |
Click here for more information about our publications!
Comments

Request Information From Our Sponsors
- StockCharts.com, Inc.
- Candle Patterns
- Candlestick Charting Explained
- Intermarket Technical Analysis
- John Murphy on Chart Analysis
- John Murphy's Chart Pattern Recognition
- John Murphy's Market Message
- MurphyExplainsMarketAnalysis-Intermarket Analysis
- MurphyExplainsMarketAnalysis-Visual Analysis
- StockCharts.com
- Technical Analysis of the Financial Markets
- The Visual Investor
- VectorVest, Inc.
- Executive Premier Workshop
- One-Day Options Course
- OptionsPro
- Retirement Income Workshop
- Sure-Fire Trading Systems (VectorVest, Inc.)
- Trading as a Business Workshop
- VectorVest 7 EOD
- VectorVest 7 RealTime/IntraDay
- VectorVest AutoTester
- VectorVest Educational Services
- VectorVest OnLine
- VectorVest Options Analyzer
- VectorVest ProGraphics v6.0
- VectorVest ProTrader 7
- VectorVest RealTime Derby Tool
- VectorVest Simulator
- VectorVest Variator
- VectorVest Watchdog