HOT TOPICS LIST
- MACD
- Fibonacci
- RSI
- Gann
- ADXR
- Stochastics
- Volume
- Triangles
- Futures
- Cycles
- Volatility
- ZIGZAG
- MESA
- Retracement
- Aroon
INDICATORS LIST
LIST OF TOPICS
PRINT THIS ARTICLE
by David Penn
The same formula that noted a bottom in March hints at another one in June.
Position: N/A
David Penn
Technical Writer for Technical Analysis of STOCKS & COMMODITIES magazine, Working-Money.com, and Traders.com Advantage.
PRINT THIS ARTICLE
REVERSAL
A 2B Test Of Bottom In The S&P 500
07/06/07 08:22:35 AMby David Penn
The same formula that noted a bottom in March hints at another one in June.
Position: N/A
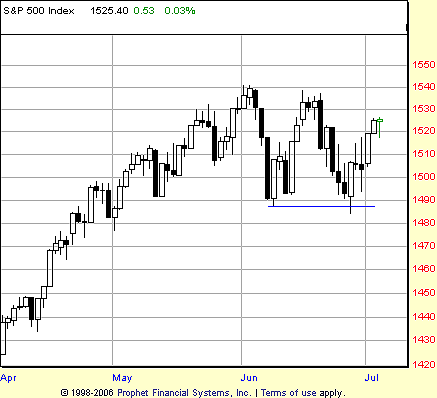
| We won't know for some time whether the 2B test of bottom that appeared in the Standard & Poor's 500 over the course of June will be as meaningful as the 2B test of bottom that occurred earlier in the year back in March (Figure 1). |
| But we can already see similarities in the pattern that (a) signal that any bearishness at this moment is likely wrongheaded and (b) provide us with renewed confidence in the effectiveness of the 2B test. |

|
| FIGURE 1: STANDARD & POORíS 500, DAILY. The lack of follow-through to the downside after the lower low is made in the second half of June paves the way for a bottom in the marketís month-long correction. |
| Graphic provided by: Prophet Financial, Inc. |
| |
| The 2B test is one of the simplest and most straightforward ways a trader can spot and exploit a reversal opportunity in the markets. At its most basic, the 2B test of top or bottom says that when a market makes an extreme point — a new high or a new low — and then returns to test that point, failure to follow through on that test with another new high or another new low often doesn't just mean an end to the trend; it often means that the trend is vulnerable to reverse. |
| This was exactly what happened to the S&P 500 back in March. As I wrote at the time (see my Traders.com Advantage article "Short-Term 2B Bottom In The S&P 500" from March 16, 2007), the inability of the market to move lower as it made a lower low in the second half of March was a major signal that the correction had run its course. |
| As is often the case in these instances, bearishness and pessimism were running amok. While sentiment indicators like the volatility index and the put/call ratio are certainly helpful tools, even a half-engaged eavesdropping on CNBC often provides all you need to know to figure out when traders are in panic mode — and ripe for the picking. |
Technical Writer for Technical Analysis of STOCKS & COMMODITIES magazine, Working-Money.com, and Traders.com Advantage.
| Title: | Technical Writer |
| Company: | Technical Analysis, Inc. |
| Address: | 4757 California Avenue SW |
| Seattle, WA 98116 | |
| Phone # for sales: | 206 938 0570 |
| Fax: | 206 938 1307 |
| Website: | www.Traders.com |
| E-mail address: | DPenn@traders.com |
Traders' Resource Links | |
| Charting the Stock Market: The Wyckoff Method -- Books | |
| Working-Money.com -- Online Trading Services | |
| Traders.com Advantage -- Online Trading Services | |
| Technical Analysis of Stocks & Commodities -- Publications and Newsletters | |
| Working Money, at Working-Money.com -- Publications and Newsletters | |
| Traders.com Advantage -- Publications and Newsletters | |
| Professional Traders Starter Kit -- Software | |
Click here for more information about our publications!
PRINT THIS ARTICLE

Request Information From Our Sponsors
- StockCharts.com, Inc.
- Candle Patterns
- Candlestick Charting Explained
- Intermarket Technical Analysis
- John Murphy on Chart Analysis
- John Murphy's Chart Pattern Recognition
- John Murphy's Market Message
- MurphyExplainsMarketAnalysis-Intermarket Analysis
- MurphyExplainsMarketAnalysis-Visual Analysis
- StockCharts.com
- Technical Analysis of the Financial Markets
- The Visual Investor
- VectorVest, Inc.
- Executive Premier Workshop
- One-Day Options Course
- OptionsPro
- Retirement Income Workshop
- Sure-Fire Trading Systems (VectorVest, Inc.)
- Trading as a Business Workshop
- VectorVest 7 EOD
- VectorVest 7 RealTime/IntraDay
- VectorVest AutoTester
- VectorVest Educational Services
- VectorVest OnLine
- VectorVest Options Analyzer
- VectorVest ProGraphics v6.0
- VectorVest ProTrader 7
- VectorVest RealTime Derby Tool
- VectorVest Simulator
- VectorVest Variator
- VectorVest Watchdog
