HOT TOPICS LIST
- MACD
- Fibonacci
- RSI
- Gann
- ADXR
- Stochastics
- Volume
- Triangles
- Futures
- Cycles
- Volatility
- ZIGZAG
- MESA
- Retracement
- Aroon
INDICATORS LIST
LIST OF TOPICS
PRINT THIS ARTICLE
by Koos van der Merwe
I don't like drill holes of hope, so why do I like this one?
Position: Accumulate
Koos van der Merwe
Has been a technical analyst since 1969, and has worked as a futures and options trader with First Financial Futures in Johannesburg, South Africa.
PRINT THIS ARTICLE
OSCILLATORS
Is Goldbrook Ventures Promising?
07/05/07 11:40:14 AMby Koos van der Merwe
I don't like drill holes of hope, so why do I like this one?
Position: Accumulate
| Goldbrook Ventures is engaged in the exploration for nickel-copper-platinum group element sulphide deposits — a class of mineral deposit that, due to its polymetallic nature, has the advantage of protection against individual metal price cycles and has strong long-term supply–demand fundamentals. |
| Every morning, I run an exploration using MetaStock to identify shares that could be a possible buy. The parameters I use are: A-Close B-The stochastic RSI formula. C-A five-period simple moving average of the volume > 100,000 D-The probability rate of change formula E-Volatility These formulas are then applied to the US and Canadian markets to identify those stocks that meet these parameters. (All formulas are available on request.) The stocks highlighted are then sorted by their probability and the top two stocks are chosen for investment. I also look at the volatility and tend to select those stocks where the volatility is positive above those where the volatility is negative, but volatility is not incorporated into the filter. For June, the selected portfolio held 19 stocks, of which eight finished the month in negative territory. Two of the stocks triggered stop-loss orders and were closed out, but in monitoring them they both finished the month in positive territory, with one of them, Beartooth Platinum (BTO-V), giving a 9.09% profit. This suggests that my stop at 6% could be too tight. The portfolio finished the month with a profit of 5.57%. I shall be monitoring a new portfolio for July. |

|
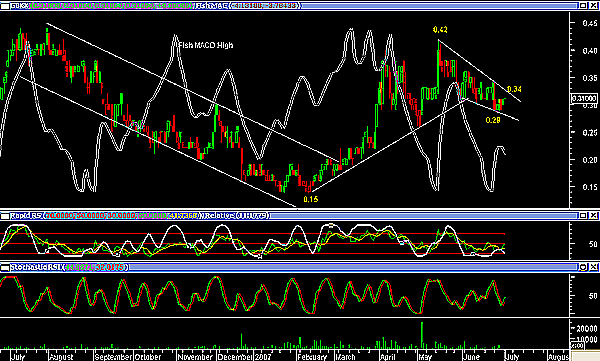
| FIGURE 1: GOLDBROOK VENTURES. This chart shows the indicators used in the exploration that highlighted this company as a possible buy. |
| Graphic provided by: MetaStock. |
| |
| Figure 2 shows the following: a: A candlestick chart of the shares showing how the share moved from a low of $0.15 in February 2007 to the high of $0.42 by May 2007. From this date, the stock price has fallen in what could well be a pennant. If this is true, then a move above the resistance line at 0.34 would see a target of $0.56. b: The indicator on the chart, FishMACDHigh, is a Fisher transform calculation of the moving average convergence/divergence (MACD) of the high. The indicator is a good trend-follower and helps in decision-making. c-Rapid RSI (green and yellow) and relative strength spread (white line) acts as a confirmation to the stochastic RSI in the window below it. d-Volume. Volume has been falling as the stock price rose, suggesting short-term weakness. |
| To conclude, this is a stock I will be adding to my portfolio as and when the price breaks above the $0.34 level. |
Has been a technical analyst since 1969, and has worked as a futures and options trader with First Financial Futures in Johannesburg, South Africa.
| Address: | 3256 West 24th Ave |
| Vancouver, BC | |
| Phone # for sales: | 6042634214 |
| E-mail address: | petroosp@gmail.com |
Click here for more information about our publications!
PRINT THIS ARTICLE

Request Information From Our Sponsors
- VectorVest, Inc.
- Executive Premier Workshop
- One-Day Options Course
- OptionsPro
- Retirement Income Workshop
- Sure-Fire Trading Systems (VectorVest, Inc.)
- Trading as a Business Workshop
- VectorVest 7 EOD
- VectorVest 7 RealTime/IntraDay
- VectorVest AutoTester
- VectorVest Educational Services
- VectorVest OnLine
- VectorVest Options Analyzer
- VectorVest ProGraphics v6.0
- VectorVest ProTrader 7
- VectorVest RealTime Derby Tool
- VectorVest Simulator
- VectorVest Variator
- VectorVest Watchdog
- StockCharts.com, Inc.
- Candle Patterns
- Candlestick Charting Explained
- Intermarket Technical Analysis
- John Murphy on Chart Analysis
- John Murphy's Chart Pattern Recognition
- John Murphy's Market Message
- MurphyExplainsMarketAnalysis-Intermarket Analysis
- MurphyExplainsMarketAnalysis-Visual Analysis
- StockCharts.com
- Technical Analysis of the Financial Markets
- The Visual Investor
