HOT TOPICS LIST
- MACD
- Fibonacci
- RSI
- Gann
- ADXR
- Stochastics
- Volume
- Triangles
- Futures
- Cycles
- Volatility
- ZIGZAG
- MESA
- Retracement
- Aroon
INDICATORS LIST
LIST OF TOPICS
PRINT THIS ARTICLE
by Chaitali Mohile
A gap breakout has generated buying opportunities and has also broken out of a trend reversal pattern.
Position: Buy
Chaitali Mohile
Active trader in the Indian stock markets since 2003 and a full-time writer. Trading is largely based upon technical analysis.
PRINT THIS ARTICLE
GAPS
Apollo Group Rallies On Gap Breakout
07/03/07 03:33:15 PMby Chaitali Mohile
A gap breakout has generated buying opportunities and has also broken out of a trend reversal pattern.
Position: Buy
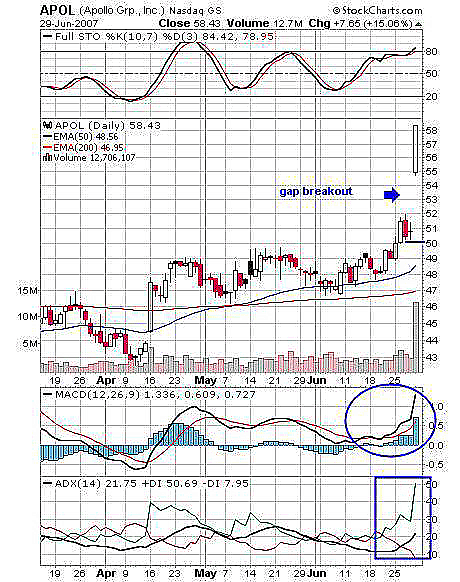
| If traded correctly, gap breakouts can be interesting. Gaps are unpredictable till they actually occur. Many major resistances get violated with a gap breakout. One such breakout has appeared in Apollo Group (APOL) (Figure 1). The high-volatility sessions range was violated by this gap breakout. The stock formed a doji candlestick recently, but a sudden gap up encouraged many buyers to go for fresh long positions. |

|
| FIGURE 1: APOL, DAILY. The upper-range resistance was crossed by a gap breakout. |
| Graphic provided by: StockCharts.com. |
| |
| The stochastic oscillator (10, 7, 3) has moved to 80, indicating a positive sign for a bullish rally. The moving average convergence/divergence (MACD)(12, 26, 9) has remained positive after a strong bullish crossover. In addition, the average directional moving index (ADX)(14) at 21 is indicating a developing uptrend. Thus, all the indicators are positive, and fresh buying opportunities are available with a minimum target of $3. This profit level is measured on the upper range level (52) and an actual gap breakout (of approximately 55). |
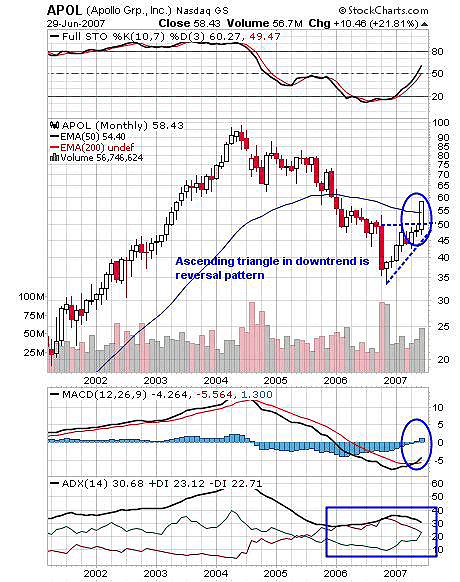
| Figure 2 shows something more interesting. The monthly chart shows a long downtrend in APOL since mid-2004. The stock, which was worth $100 a share in 2004, moved to $35 in late 2006. The stock then bottomed out near the 35 level and began its upward journey. Currently, APOL has been forming an ascending triangle while moving upward, and traders can note that an ascending triangle in a downtrend is a trend reversal pattern. For more confirmation about the trend, let's examine the ADX (14). The ADX (14) is 30, and +DI 22 is ready to move above -DI 23, indicating increasing buying pressure. This shows that bulls are ready to take over the trend. |

|
| FIGURE 2: APOL, MONTHLY. An ascending triangle was formed as the stock began its upside move. The gap breakout made the stock move above the triangle. |
| Graphic provided by: StockCharts.com. |
| |
| But monthly is a very long-term view, so short-term trades can take a view about a trend reversal pattern only and not any buying position. For fresh buying, the target is set according to the daily chart (Figure 1). Those investors who are looking for long term investments can follow the monthly chart (Figure 2). |
Active trader in the Indian stock markets since 2003 and a full-time writer. Trading is largely based upon technical analysis.
| Company: | Independent |
| Address: | C1/3 Parth Indraprasth Towers. Vastrapur |
| Ahmedabad, Guj 380015 | |
| E-mail address: | chaitalimohile@yahoo.co.in |
Traders' Resource Links | |
| Independent has not added any product or service information to TRADERS' RESOURCE. | |
Click here for more information about our publications!
PRINT THIS ARTICLE

Request Information From Our Sponsors
- StockCharts.com, Inc.
- Candle Patterns
- Candlestick Charting Explained
- Intermarket Technical Analysis
- John Murphy on Chart Analysis
- John Murphy's Chart Pattern Recognition
- John Murphy's Market Message
- MurphyExplainsMarketAnalysis-Intermarket Analysis
- MurphyExplainsMarketAnalysis-Visual Analysis
- StockCharts.com
- Technical Analysis of the Financial Markets
- The Visual Investor
- VectorVest, Inc.
- Executive Premier Workshop
- One-Day Options Course
- OptionsPro
- Retirement Income Workshop
- Sure-Fire Trading Systems (VectorVest, Inc.)
- Trading as a Business Workshop
- VectorVest 7 EOD
- VectorVest 7 RealTime/IntraDay
- VectorVest AutoTester
- VectorVest Educational Services
- VectorVest OnLine
- VectorVest Options Analyzer
- VectorVest ProGraphics v6.0
- VectorVest ProTrader 7
- VectorVest RealTime Derby Tool
- VectorVest Simulator
- VectorVest Variator
- VectorVest Watchdog
