HOT TOPICS LIST
- MACD
- Fibonacci
- RSI
- Gann
- ADXR
- Stochastics
- Volume
- Triangles
- Futures
- Cycles
- Volatility
- ZIGZAG
- MESA
- Retracement
- Aroon
INDICATORS LIST
LIST OF TOPICS
PRINT THIS ARTICLE
by Chaitali Mohile
A signal's bullish formation can get ignored by overheated indicators, resulting in a pause in an ongoing bullish rally.
Position: N/A
Chaitali Mohile
Active trader in the Indian stock markets since 2003 and a full-time writer. Trading is largely based upon technical analysis.
PRINT THIS ARTICLE
TAX PLANNING
VSE's Bullish Rally May Halt
07/02/07 03:18:58 PMby Chaitali Mohile
A signal's bullish formation can get ignored by overheated indicators, resulting in a pause in an ongoing bullish rally.
Position: N/A
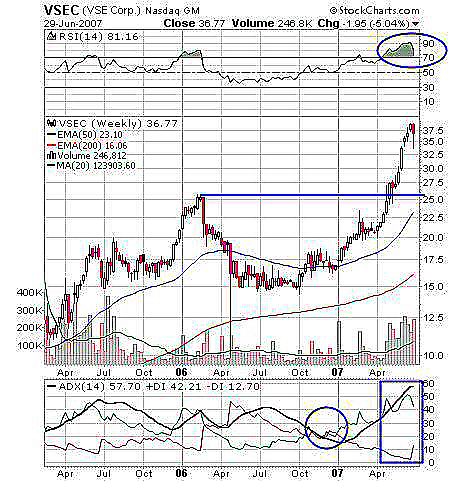
| VSE Corp. (VSEC) broke out of a rounding pattern at the 25 level in heavy volume. The stock rallied to $37.50, gaining almost $12 from the breakout. The upside move was supported by the bullish strength of the relative strength index (RSI)(14). Gradually, the indicator moved to the overbought zone as the price moved ahead. The RSI (14) sustained in an overbought area for a longer time and carried on in a bullish rally. In Figure 1, VSEC rallied from $25 to $37.50 with a highly overbought RSI (14). But now, the RSI (14) lost its hold on the rally, ready to run down from its highs. This down move of the indicator will result in temporary changes in price as well. The stock may consolidate as a reaction to the RSI (14) dip. Till the RSI (14) holds above the 50 level, traders can see a minor pause in the bullish action. |

|
| FIGURE 1: VSEC, WEEKLY. A highly overbought RSI and an overheated ADX can result in a price consolidation or a minor dip. |
| Graphic provided by: StockCharts.com. |
| |
| Again, if we begin with a trend indicator, the average directional movement index (ADX)(14) showed a choppy move while a rounding pattern was getting formed. The ultimate price breakout brought a heavy buying pressure, turning the ADX (14), and the uptrend moved stronger from its jittery position. At present, the ADX (14) is highly overheated at the 54 level, and hence, it can result in some price consolidation. By this, the uptrend can witness some shaky moves. But till the ADX (14) remains above the 20 level and +DI remains above -DI, the uptrend exists. |

|
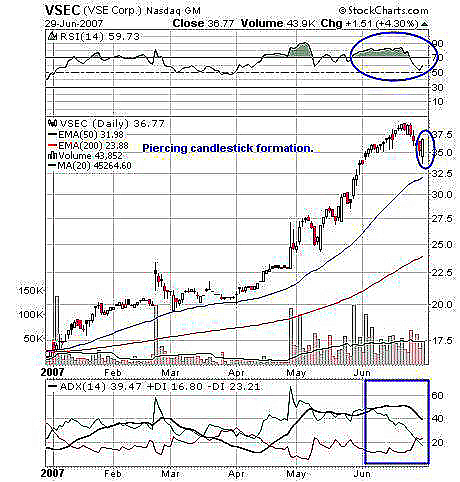
| FIGURE 2: VSEC, DAILY. A piercing candlestick bullish reversal pattern can get ignored by two indicators. |
| Graphic provided by: StockCharts.com. |
| |
| In Figure 2, the RSI (14) has slipped down from its overbought position but established support at its golden level of 50. The signal's bullish formation is a piercing candlestick formation (marked with circle) (Figure 2). This formation is made of two candles, first black (here red) and second white in a bullish reversal pattern. This formation indicates the stock may see a bullish rally with a resistance at a high pivot of $37.50. |
| The ADX (14) is 39, with +DI at 16 and -DI at 23. +DI has moved below -DI, indicating weakness in buying. There is marginally a difference in both the directional indexes, so it's difficult to recognize the trend strength. In such a situation, the trend can be taken over by buyers or sellers. In addition, the volume is reducing gradually and can be considered a cautious signal. |
| Thus, profit booking in VSEC is recommended. The bullish candlestick formation can be neglected by other indicators, confirming consolidation or a minor dip in the security. |
Active trader in the Indian stock markets since 2003 and a full-time writer. Trading is largely based upon technical analysis.
| Company: | Independent |
| Address: | C1/3 Parth Indraprasth Towers. Vastrapur |
| Ahmedabad, Guj 380015 | |
| E-mail address: | chaitalimohile@yahoo.co.in |
Traders' Resource Links | |
| Independent has not added any product or service information to TRADERS' RESOURCE. | |
Click here for more information about our publications!
PRINT THIS ARTICLE

Request Information From Our Sponsors
- StockCharts.com, Inc.
- Candle Patterns
- Candlestick Charting Explained
- Intermarket Technical Analysis
- John Murphy on Chart Analysis
- John Murphy's Chart Pattern Recognition
- John Murphy's Market Message
- MurphyExplainsMarketAnalysis-Intermarket Analysis
- MurphyExplainsMarketAnalysis-Visual Analysis
- StockCharts.com
- Technical Analysis of the Financial Markets
- The Visual Investor
- VectorVest, Inc.
- Executive Premier Workshop
- One-Day Options Course
- OptionsPro
- Retirement Income Workshop
- Sure-Fire Trading Systems (VectorVest, Inc.)
- Trading as a Business Workshop
- VectorVest 7 EOD
- VectorVest 7 RealTime/IntraDay
- VectorVest AutoTester
- VectorVest Educational Services
- VectorVest OnLine
- VectorVest Options Analyzer
- VectorVest ProGraphics v6.0
- VectorVest ProTrader 7
- VectorVest RealTime Derby Tool
- VectorVest Simulator
- VectorVest Variator
- VectorVest Watchdog
