HOT TOPICS LIST
- MACD
- Fibonacci
- RSI
- Gann
- ADXR
- Stochastics
- Volume
- Triangles
- Futures
- Cycles
- Volatility
- ZIGZAG
- MESA
- Retracement
- Aroon
INDICATORS LIST
LIST OF TOPICS
PRINT THIS ARTICLE
by David Penn
The triple-smoothed exponential moving average (TRIX) is a useful momentum oscillator that can provide signals in a number of ways.
Position: N/A
David Penn
Technical Writer for Technical Analysis of STOCKS & COMMODITIES magazine, Working-Money.com, and Traders.com Advantage.
PRINT THIS ARTICLE
TRIX
TRIX: Divergences And Hooks
07/02/07 11:24:09 AMby David Penn
The triple-smoothed exponential moving average (TRIX) is a useful momentum oscillator that can provide signals in a number of ways.
Position: N/A
| The triple-smoothed exponential moving average (TRIX) was introduced in the pages of Technical Analysis of STOCKS & COMMODITIES more than 20 years ago. The author of that introduction was none other than TASC publisher Jack Hutson, who wrote about an indicator that accomplished two primary goals every trader looks for in a technical indicator. The first goal was that the indicator filter random market noise, and the second was that the indicator provide a positive timely signal. In other words, the indicator should not be a pest, ringing you at all hours of the night. But at the same time, if there were an urgent call, the indicator had to be sensitive enough to let the call go through. |
| To recap, the TRIX is constructed by taking an initial exponential moving average, taking an exponential moving average of that first exponential moving average, and then taking a third exponential moving average of that last exponential moving average. Finally, take a one-period rate-of-change of the third, now triple-smoothed, exponential moving average to get the TRIX. There are a number of different ways to use TRIX. One of the methods involves creating a signal line and using various types of crosses between TRIX and the signal line to provide signals. Other methods, on the other hand, require only the TRIX itself and can be quite effective in timing entries into the market. |

|
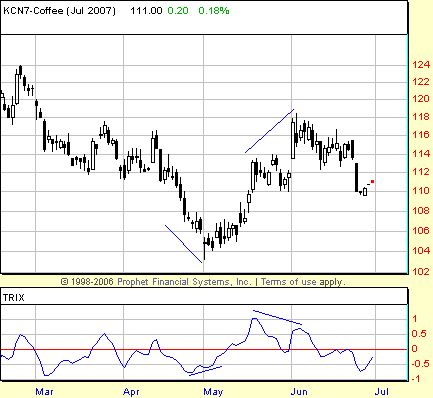
| FIGURE 1: COFFEE, JULY FUTURES, DAILY. A positive divergence in the TRIX from late April into May leads to a bounce. A negative divergence in the TRIX from mid-May to early June leads to a correction of more than 50% over the balance of the latter month. |
| Graphic provided by: Prophet Financial, Inc. |
| |
| Like most momentum oscillators, the TRIX can be used to spot divergences, instances where a market gets ahead of itself, becoming ripe for correction or even reversal. We can see in the chart of July coffee futures (Figure 1) how divergences both anticipated the bottom in early May, as well as signaling an end to the bounce in early June. In the first instance, the market continued to move lower as the TRIX moved higher. In the second instance, the market made a higher high at precisely the same time that the TRIX made a lower high. In both instances, the failure of the oscillator to track the market meant that the market's movement was suspect. So once the divergence gets you into the market, how do you continue to trade it as the trend unfolds? In a 1982 TASC article titled "Good TRIX," Hutson makes the point that the "very best results" from using TRIX come from using it to time entries in trending markets. This is one of the best ways that traders can use momentum indicators -- and not just the TRIX, but the stochastic and MACD histogram as well. |

|
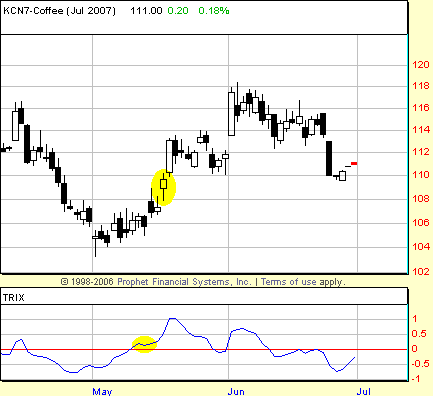
| FIGURE 2: COFFEE, JULY FUTURES, DAILY. The first hook off the positive divergence in July coffee provides a great entry point in coffee’s run from 104 to nearly 118. The highlighted oval in the lower panel represents where the hook is in the indicator. The highlighted oval in the price chart represents the confirming session during which the market closes above the high of the session during which the hook was completed. |
| Graphic provided by: Prophet Financial, Inc. |
| |
| Looking to our chart of July coffee, let's focus in on the "hooks" in the TRIX (Figure 2). By hooks, I'm referring to instances where the TRIX changes direction. Coming up from a bottom, we are looking for situations where the TRIX has been moving up, then moves down for a session or two (or more) and then "hooks" back up. If we get a follow-through close above the high of the session during which the hookup occurred, then we've got a long entry on that follow-through close. The first -- and most important -- hook comes shortly after the positive divergence in May. The TRIX makes a peak on May 10, moves down on May 11, then hooks back up on May 14. Once the hook is complete, all we need to do is wait for a close above the high of the session during which the hook was completed -- May 14. That follow-through close arrives on May 16 at 109.70, and that level is our entry. The market leaps higher the following day, closing at almost three and a half points higher (each point is worth one cent in coffee futures and each cent is worth $375). |
| And while this would be an excellent place for a short-term momentum trader to take profits, the trader who rides the move out through the end of the month is rewarded with an even higher close at the beginning of June. |
Technical Writer for Technical Analysis of STOCKS & COMMODITIES magazine, Working-Money.com, and Traders.com Advantage.
| Title: | Technical Writer |
| Company: | Technical Analysis, Inc. |
| Address: | 4757 California Avenue SW |
| Seattle, WA 98116 | |
| Phone # for sales: | 206 938 0570 |
| Fax: | 206 938 1307 |
| Website: | www.Traders.com |
| E-mail address: | DPenn@traders.com |
Traders' Resource Links | |
| Charting the Stock Market: The Wyckoff Method -- Books | |
| Working-Money.com -- Online Trading Services | |
| Traders.com Advantage -- Online Trading Services | |
| Technical Analysis of Stocks & Commodities -- Publications and Newsletters | |
| Working Money, at Working-Money.com -- Publications and Newsletters | |
| Traders.com Advantage -- Publications and Newsletters | |
| Professional Traders Starter Kit -- Software | |
Click here for more information about our publications!
Comments

Request Information From Our Sponsors
- StockCharts.com, Inc.
- Candle Patterns
- Candlestick Charting Explained
- Intermarket Technical Analysis
- John Murphy on Chart Analysis
- John Murphy's Chart Pattern Recognition
- John Murphy's Market Message
- MurphyExplainsMarketAnalysis-Intermarket Analysis
- MurphyExplainsMarketAnalysis-Visual Analysis
- StockCharts.com
- Technical Analysis of the Financial Markets
- The Visual Investor
- VectorVest, Inc.
- Executive Premier Workshop
- One-Day Options Course
- OptionsPro
- Retirement Income Workshop
- Sure-Fire Trading Systems (VectorVest, Inc.)
- Trading as a Business Workshop
- VectorVest 7 EOD
- VectorVest 7 RealTime/IntraDay
- VectorVest AutoTester
- VectorVest Educational Services
- VectorVest OnLine
- VectorVest Options Analyzer
- VectorVest ProGraphics v6.0
- VectorVest ProTrader 7
- VectorVest RealTime Derby Tool
- VectorVest Simulator
- VectorVest Variator
- VectorVest Watchdog
