HOT TOPICS LIST
- MACD
- Fibonacci
- RSI
- Gann
- ADXR
- Stochastics
- Volume
- Triangles
- Futures
- Cycles
- Volatility
- ZIGZAG
- MESA
- Retracement
- Aroon
INDICATORS LIST
LIST OF TOPICS
PRINT THIS ARTICLE
by David Penn
Lower peaks in the MACD histogram accompany the advance in the September Treasury note.
Position: N/A
David Penn
Technical Writer for Technical Analysis of STOCKS & COMMODITIES magazine, Working-Money.com, and Traders.com Advantage.
PRINT THIS ARTICLE
BOND & INTEREST RATE
Negative Divergences And The Bond Bounce
06/29/07 02:09:29 PMby David Penn
Lower peaks in the MACD histogram accompany the advance in the September Treasury note.
Position: N/A
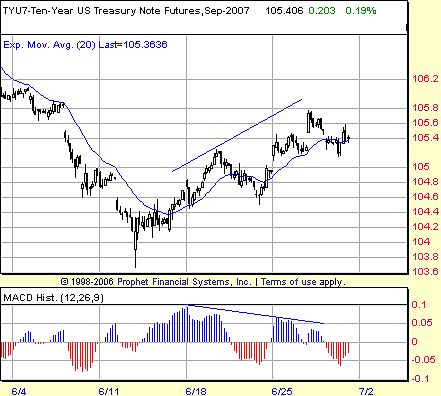
| The specter of rising long-term interest rates reached an apogee in the first half of June, as the yield on the 10-year Treasury note surged from less than 4.6 to more than 5.25 in a month. That surge is reflected in the hourly chart of the September 10-year Treasury note in Figure 1. |

|
| FIGURE 1: US TREASURY NOTE, SEPTEMBER FUTURES, HOURLY. The bounce in bonds that began in the first half of June is increasingly characterized by shorter and shorter peaks in the MACD histogram. This suggests that the move higher is losing momentum to the upside and is ripe for correction. |
| Graphic provided by: Prophet Financial, Inc. |
| |
| The moving average convergence/divergence (MACD) histogram has already provided some helpful guidance for traders on the hourly chart. The bottom was anticipated by a positive divergence, and the massive size of the histogram that develops after the positive divergence is a strong signal that prices will continue to move higher. |
| That initial "massive" histogram peak itself featured a very short-term negative divergence from the beginning of the peak to its later stages. The market was sensitive to this divergence as well, as the September T-note dipped below the 20-period exponential moving average (EMA) before moving higher and resuming the rally. |
| But the negative divergences in the MACD histogram continue to mount, which makes the rally more susceptible to reversal or, at a minimum, sideways correction. The critical support level is at 104.5. A close below this level would create a lower low, signifying if not a new downtrend, then at least the conclusion of the uptrend for the time being. |
Technical Writer for Technical Analysis of STOCKS & COMMODITIES magazine, Working-Money.com, and Traders.com Advantage.
| Title: | Technical Writer |
| Company: | Technical Analysis, Inc. |
| Address: | 4757 California Avenue SW |
| Seattle, WA 98116 | |
| Phone # for sales: | 206 938 0570 |
| Fax: | 206 938 1307 |
| Website: | www.Traders.com |
| E-mail address: | DPenn@traders.com |
Traders' Resource Links | |
| Charting the Stock Market: The Wyckoff Method -- Books | |
| Working-Money.com -- Online Trading Services | |
| Traders.com Advantage -- Online Trading Services | |
| Technical Analysis of Stocks & Commodities -- Publications and Newsletters | |
| Working Money, at Working-Money.com -- Publications and Newsletters | |
| Traders.com Advantage -- Publications and Newsletters | |
| Professional Traders Starter Kit -- Software | |
Click here for more information about our publications!
Comments

|

Request Information From Our Sponsors
- StockCharts.com, Inc.
- Candle Patterns
- Candlestick Charting Explained
- Intermarket Technical Analysis
- John Murphy on Chart Analysis
- John Murphy's Chart Pattern Recognition
- John Murphy's Market Message
- MurphyExplainsMarketAnalysis-Intermarket Analysis
- MurphyExplainsMarketAnalysis-Visual Analysis
- StockCharts.com
- Technical Analysis of the Financial Markets
- The Visual Investor
- VectorVest, Inc.
- Executive Premier Workshop
- One-Day Options Course
- OptionsPro
- Retirement Income Workshop
- Sure-Fire Trading Systems (VectorVest, Inc.)
- Trading as a Business Workshop
- VectorVest 7 EOD
- VectorVest 7 RealTime/IntraDay
- VectorVest AutoTester
- VectorVest Educational Services
- VectorVest OnLine
- VectorVest Options Analyzer
- VectorVest ProGraphics v6.0
- VectorVest ProTrader 7
- VectorVest RealTime Derby Tool
- VectorVest Simulator
- VectorVest Variator
- VectorVest Watchdog
