HOT TOPICS LIST
- MACD
- Fibonacci
- RSI
- Gann
- ADXR
- Stochastics
- Volume
- Triangles
- Futures
- Cycles
- Volatility
- ZIGZAG
- MESA
- Retracement
- Aroon
INDICATORS LIST
LIST OF TOPICS
PRINT THIS ARTICLE
by Gary Grosschadl
The Dow Jones Industrial Average is currently trying to find support from its 50-day moving average. This coincides with a possible double-top formation.
Position: Hold
Gary Grosschadl
Independent Canadian equities trader and technical analyst based in Peterborough
Ontario, Canada.
PRINT THIS ARTICLE
DOUBLE TOPS
The DJIA's Double Top Test
06/29/07 03:24:48 PMby Gary Grosschadl
The Dow Jones Industrial Average is currently trying to find support from its 50-day moving average. This coincides with a possible double-top formation.
Position: Hold
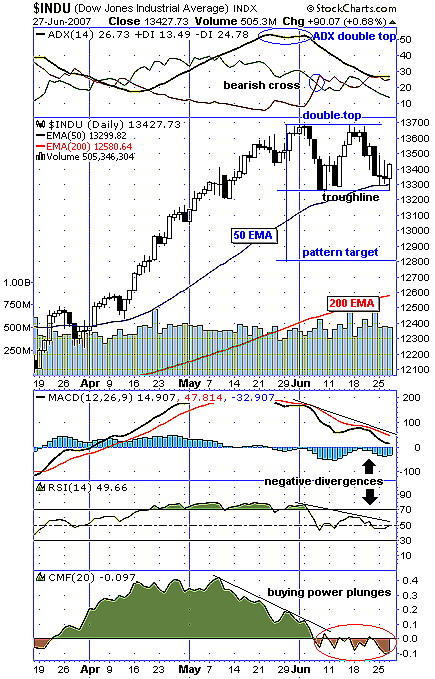
| Figure 1, a daily chart, hints at a possible bounce off the 50-day exponential moving average (EMA), which relates to previous support. This also serves as a double-top test as the symmetry looks good and the trendline is established. |
| If the bounce is good and the bulls have enough stamina, a triple top via a third peak is a possibility. If instead it falters and closes below the trendline at about 13250, then the double top looks good and the completion target would be at about 12800. The completion target for this pattern is the distance from the peak to the trendline, as applied to a downside break below the trendline. Note that the ever-important 200-day EMA currently looms 200 points below that target at 12600. |

|
| FIGURE 1: DJIA, DAILY. There's a possible double top for the Dow Jones Industrial Average if the trendline fails on this chart. |
| Graphic provided by: StockCharts.com. |
| |
| Several indicators reflect quite a bearish tone. At the top of the chart, the average directional movement index (ADX) shows a somewhat rare pattern. It's not often we see a double top of the ADX line. That clearly led to a bearish cross of its DI lines, or directional indicators. In simpler terms, the previous bullish trend is over. Below the chart the moving average convergence/divergence (MACD) and the relative strength index (RSI) are showing pronounced negative divergences to recent price action. This foretold the ensuing test of the previous support of the double top trendline. But is it really over? That is the real question. Renewed downside is something to be wary of, especially when considering the Chaikin money flow indicator (CMF). The CMF shows a severe erosion of bullish buying power. If the bulls have left the party, who will drive this index to new heights? |
| All things considered, I will be surprised if a third peak ensues before further downside is explored. Keep your eye on the trendline; a close below spells trouble. As always, the market has the final say. |
Independent Canadian equities trader and technical analyst based in Peterborough
Ontario, Canada.
| Website: | www.whatsonsale.ca/financial.html |
| E-mail address: | gwg7@sympatico.ca |
Click here for more information about our publications!
PRINT THIS ARTICLE

Request Information From Our Sponsors
- VectorVest, Inc.
- Executive Premier Workshop
- One-Day Options Course
- OptionsPro
- Retirement Income Workshop
- Sure-Fire Trading Systems (VectorVest, Inc.)
- Trading as a Business Workshop
- VectorVest 7 EOD
- VectorVest 7 RealTime/IntraDay
- VectorVest AutoTester
- VectorVest Educational Services
- VectorVest OnLine
- VectorVest Options Analyzer
- VectorVest ProGraphics v6.0
- VectorVest ProTrader 7
- VectorVest RealTime Derby Tool
- VectorVest Simulator
- VectorVest Variator
- VectorVest Watchdog
- StockCharts.com, Inc.
- Candle Patterns
- Candlestick Charting Explained
- Intermarket Technical Analysis
- John Murphy on Chart Analysis
- John Murphy's Chart Pattern Recognition
- John Murphy's Market Message
- MurphyExplainsMarketAnalysis-Intermarket Analysis
- MurphyExplainsMarketAnalysis-Visual Analysis
- StockCharts.com
- Technical Analysis of the Financial Markets
- The Visual Investor
