HOT TOPICS LIST
- MACD
- Fibonacci
- RSI
- Gann
- ADXR
- Stochastics
- Volume
- Triangles
- Futures
- Cycles
- Volatility
- ZIGZAG
- MESA
- Retracement
- Aroon
INDICATORS LIST
LIST OF TOPICS
PRINT THIS ARTICLE
by David Penn
Using the relative strength index to spot potential turns in the market.
Position: N/A
David Penn
Technical Writer for Technical Analysis of STOCKS & COMMODITIES magazine, Working-Money.com, and Traders.com Advantage.
PRINT THIS ARTICLE
WILDER'S RSI
RSI: Platinum's Failure Swing
06/28/07 03:41:19 PMby David Penn
Using the relative strength index to spot potential turns in the market.
Position: N/A
| I have never been a huge fan of the relative strength index (RSI). It's nothing personal; it's just that I always found oscillators like the stochastic and the moving average convergence/divergence histogram (MACDH) and the TRIX to be more helpful for the kind of technical analysis I do. One of the things I have found interesting about the RSI, though, was the idea of the failure swing. The failure swing in the RSI occurs when the indicator reaches an extreme, either overbought or oversold, and then pulls back out of extreme territory. Traders then look to see if the market makes another move toward the extreme — only this time failing to enter overbought or oversold territory. |
| If the market moves back below the low between the two peaks (in the example of an uptrend) or back up above the high between the two troughs (in the example of a downtrend), then the market has made what J. Welles Wilder called a "failure swing." As such, the market is increasingly vulnerable to reversal. |

|
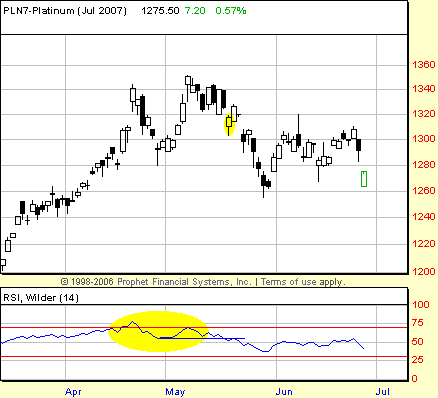
| FIGURE 1: PLATINUM, JULY FUTURES, DAILY. At the same time that July platinum was developing a negative or bearish divergence in the spring, a failure swing was setting up. The failure swing was confirmed by mid-May, when the RSI fell below the low point between the April and May peaks. |
| Graphic provided by: Prophet Financial, Inc. |
| |
| The chart of platinum futures in Figure 1 provides an example of a failure swing in action. Note how the market made a high in April, pulled back, and made a higher high in May. At the same time, the relative strength index made a high in April and a lower high in May. This in and of itself created a bearish, negative divergence that should have alerted traders to the vulnerability of the platinum market to correction. |
| Failure swings can appear with or without being a part of a divergence. Here, the failure swing appears as part of a divergence. Regardless, however, we can see how the failure swing develops. Note how the second, lower high does not penetrate into the overbought zone, and instead, moves down and, by the middle of May, has passed below the low point between the two peaks. The moment the market does so on a closing basis, the trader can consider making a bet against the market. |
| Using the example in Figure 1, the trader would have gotten the signal on May 17 with a close of 1317.90. Going short the following open, the trader would have a short entry at approximately 1314. Although the market moved higher on the day of entry — rallying as high as 1328 — within days the platinum market was in full retreat. Five days after the short entry, July platinum was trading at 1277.80 and still moving lower. |
Technical Writer for Technical Analysis of STOCKS & COMMODITIES magazine, Working-Money.com, and Traders.com Advantage.
| Title: | Technical Writer |
| Company: | Technical Analysis, Inc. |
| Address: | 4757 California Avenue SW |
| Seattle, WA 98116 | |
| Phone # for sales: | 206 938 0570 |
| Fax: | 206 938 1307 |
| Website: | www.Traders.com |
| E-mail address: | DPenn@traders.com |
Traders' Resource Links | |
| Charting the Stock Market: The Wyckoff Method -- Books | |
| Working-Money.com -- Online Trading Services | |
| Traders.com Advantage -- Online Trading Services | |
| Technical Analysis of Stocks & Commodities -- Publications and Newsletters | |
| Working Money, at Working-Money.com -- Publications and Newsletters | |
| Traders.com Advantage -- Publications and Newsletters | |
| Professional Traders Starter Kit -- Software | |
Click here for more information about our publications!
Comments

Request Information From Our Sponsors
- StockCharts.com, Inc.
- Candle Patterns
- Candlestick Charting Explained
- Intermarket Technical Analysis
- John Murphy on Chart Analysis
- John Murphy's Chart Pattern Recognition
- John Murphy's Market Message
- MurphyExplainsMarketAnalysis-Intermarket Analysis
- MurphyExplainsMarketAnalysis-Visual Analysis
- StockCharts.com
- Technical Analysis of the Financial Markets
- The Visual Investor
- VectorVest, Inc.
- Executive Premier Workshop
- One-Day Options Course
- OptionsPro
- Retirement Income Workshop
- Sure-Fire Trading Systems (VectorVest, Inc.)
- Trading as a Business Workshop
- VectorVest 7 EOD
- VectorVest 7 RealTime/IntraDay
- VectorVest AutoTester
- VectorVest Educational Services
- VectorVest OnLine
- VectorVest Options Analyzer
- VectorVest ProGraphics v6.0
- VectorVest ProTrader 7
- VectorVest RealTime Derby Tool
- VectorVest Simulator
- VectorVest Variator
- VectorVest Watchdog
