HOT TOPICS LIST
- MACD
- Fibonacci
- RSI
- Gann
- ADXR
- Stochastics
- Volume
- Triangles
- Futures
- Cycles
- Volatility
- ZIGZAG
- MESA
- Retracement
- Aroon
INDICATORS LIST
LIST OF TOPICS
PRINT THIS ARTICLE
by Chaitali Mohile
While moving in a downward channel, $COMPQ established support at a low pivot and a moving average.
Position: N/A
Chaitali Mohile
Active trader in the Indian stock markets since 2003 and a full-time writer. Trading is largely based upon technical analysis.
PRINT THIS ARTICLE
CHANNEL LINES
Which Way For The NASDAQ Composite?
06/28/07 09:21:40 AMby Chaitali Mohile
While moving in a downward channel, $COMPQ established support at a low pivot and a moving average.
Position: N/A
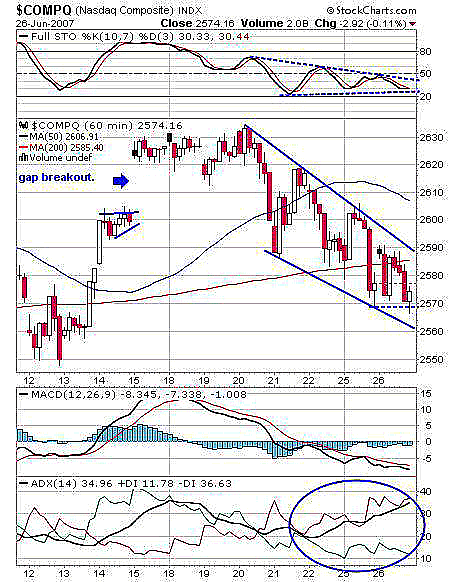
| The NASDAQ Composite ($COMPQ) consolidated after the gap breakout of a flag & pennant formation on June 15. The index should have moved toward the target instead of consolidation, sparking the idea of topping out. Figure 1 shows that the index was sideways for about four days and then plunged on the June 20th session, losing 40 points. The series of lower highs and lower lows formed a downward channel on the price charts, and the NASDAQ Composite drifted below the support of a 200-day moving average (MA). Thereafter, the 50-day MA also tipped downside and the 200-day MA turned toward the bullish rally. Yesterday's closing candle touched the previous session low, avoiding a further fall for the day. But traders were left with uncertainty about the direction. The downward channel is likely to continue going down, but the support offered by a low pivot can give a pullback rally within the channel, which is worth little. As such, the rally is just for observation. Again, the 200-day MA is a strong resistance in the channel. |

|
| FIGURE 1: $COMPQ, HOURLY. The NASDAQ Composite moves in a downward channel with the 200-day MA resistance within. |
| Graphic provided by: StockCharts.com. |
| |
| In Figure 1, the stochastic (10, 7, 3) has a triangle formation with an unknown breakout direction. The moving average convergence/divergence (MACD)(12, 26, 9) continued to remain negative and moved below the zero line. This is again a negative indication for any bullish rally and reassures the correct direction of a downward channel. The trend is already grabbed by bears. The average directional index (ADX)(14) is 34 with the negative directional index (-DI) at 36, whereas (+DI) the positive directional index at 11. This indicates a strong developed downtrend. |

|
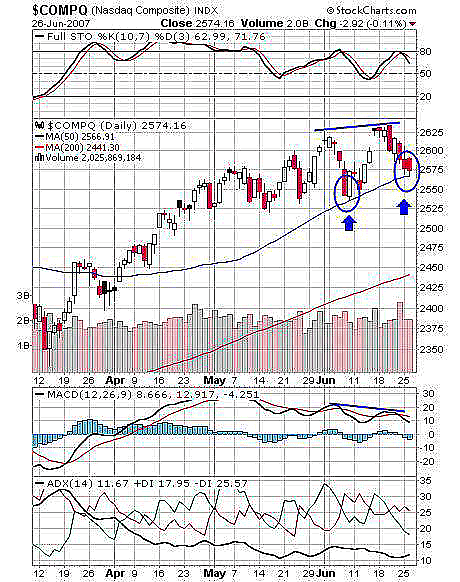
| FIGURE 2: $COMPQ, DAILY. The 50-day MA offered support twice at two different levels. |
| Graphic provided by: StockCharts.com. |
| |
| On Figure 2, the $COMPQ established support on the 50-day MA twice, though higher lows were formed. The initial low was around the 2535 level with a bullish candle, whereas yesterday and the day before formed a completely filled bearish candle on support of the 50-day MA at the 2570 level. So it's hard to judge the bullish rally from the current support of the 50-day MA. |
| The moving average convergence/divergence has negative divergence, the results of which are already reflected on the price chart. The ADX (14) is at 11, indicating the nonexistence of either trend, and -DI and +DI are clashing with equal strength. |
| So in present condition, the bears are ruling the index with a minor pullback rally. Sitting patiently will be most fruitful. |
Active trader in the Indian stock markets since 2003 and a full-time writer. Trading is largely based upon technical analysis.
| Company: | Independent |
| Address: | C1/3 Parth Indraprasth Towers. Vastrapur |
| Ahmedabad, Guj 380015 | |
| E-mail address: | chaitalimohile@yahoo.co.in |
Traders' Resource Links | |
| Independent has not added any product or service information to TRADERS' RESOURCE. | |
Click here for more information about our publications!
PRINT THIS ARTICLE

Request Information From Our Sponsors
- VectorVest, Inc.
- Executive Premier Workshop
- One-Day Options Course
- OptionsPro
- Retirement Income Workshop
- Sure-Fire Trading Systems (VectorVest, Inc.)
- Trading as a Business Workshop
- VectorVest 7 EOD
- VectorVest 7 RealTime/IntraDay
- VectorVest AutoTester
- VectorVest Educational Services
- VectorVest OnLine
- VectorVest Options Analyzer
- VectorVest ProGraphics v6.0
- VectorVest ProTrader 7
- VectorVest RealTime Derby Tool
- VectorVest Simulator
- VectorVest Variator
- VectorVest Watchdog
- StockCharts.com, Inc.
- Candle Patterns
- Candlestick Charting Explained
- Intermarket Technical Analysis
- John Murphy on Chart Analysis
- John Murphy's Chart Pattern Recognition
- John Murphy's Market Message
- MurphyExplainsMarketAnalysis-Intermarket Analysis
- MurphyExplainsMarketAnalysis-Visual Analysis
- StockCharts.com
- Technical Analysis of the Financial Markets
- The Visual Investor
