HOT TOPICS LIST
- MACD
- Fibonacci
- RSI
- Gann
- ADXR
- Stochastics
- Volume
- Triangles
- Futures
- Cycles
- Volatility
- ZIGZAG
- MESA
- Retracement
- Aroon
INDICATORS LIST
LIST OF TOPICS
PRINT THIS ARTICLE
by Gary Grosschadl
When a stock or index is overextended, it can suddenly correct at the first candlestick warning or defy gravity a while longer.
Position: Sell
Gary Grosschadl
Independent Canadian equities trader and technical analyst based in Peterborough
Ontario, Canada.
PRINT THIS ARTICLE
CANDLESTICK CHARTING
Three Strikes For The NASDAQ?
06/27/07 02:49:10 PMby Gary Grosschadl
When a stock or index is overextended, it can suddenly correct at the first candlestick warning or defy gravity a while longer.
Position: Sell
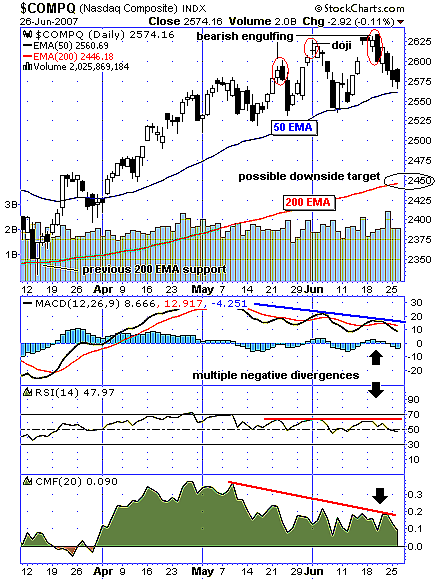
| This daily chart of the high-tech index shows three bearish candlestick formations (Figure 1). The first bearish engulfing pattern was quickly forgiven — call it strike 1. The second warning (strike 2) came as a doji candlestick; after an extended rise, dojis often mark a pending reversal. This one only precipitated three down days. Now another bearish engulfing candlestick has appeared, bigger and uglier than the first one. This third warning could be strike 3. Three warnings will not go unnoticed; call me superstitious, but technical analysis is rife with patterns involving threes — triple tops & bottoms, head & shoulders, three white soldiers, three black crows, and so on. |
| Multiple negative divergences (three of them) often point at a run being overextended and due for a correction. The moving average convergence/divergence (MACD), the relative strength index (RSI), and the Chaikin money flow indicator (MF) all show diverging action. As the index makes new highs, these indicators fail to confirm the bullish price action. This is certainly a bearish indication, but the question will be: When and how much? |

|
| FIGURE 1: NASDAQ, DAILY. The chart hints at three strikes via bearish candlestick formations. |
| Graphic provided by: StockCharts.com. |
| |
| Note the previous good support from the 50-day exponential moving average (EMA). A close under this level could be the final nail in this coffin. Moving averages often are likened to natural trendlines. A support trendline drawn would closely match this EMA. Should a sizable correction occur, look to the always important 200-day EMA as a likely downside target or test; note the previous successful test of the 200-day EMA last May. |
| In summary, this index has warned three times of a possible top. The bulls are starting to waiver, say the indicators. The umpire is watching the 50-day EMA, and failure there could be a run south to stronger support. Time will tell soon enough. |
Independent Canadian equities trader and technical analyst based in Peterborough
Ontario, Canada.
| Website: | www.whatsonsale.ca/financial.html |
| E-mail address: | gwg7@sympatico.ca |
Click here for more information about our publications!
PRINT THIS ARTICLE

Request Information From Our Sponsors
- VectorVest, Inc.
- Executive Premier Workshop
- One-Day Options Course
- OptionsPro
- Retirement Income Workshop
- Sure-Fire Trading Systems (VectorVest, Inc.)
- Trading as a Business Workshop
- VectorVest 7 EOD
- VectorVest 7 RealTime/IntraDay
- VectorVest AutoTester
- VectorVest Educational Services
- VectorVest OnLine
- VectorVest Options Analyzer
- VectorVest ProGraphics v6.0
- VectorVest ProTrader 7
- VectorVest RealTime Derby Tool
- VectorVest Simulator
- VectorVest Variator
- VectorVest Watchdog
- StockCharts.com, Inc.
- Candle Patterns
- Candlestick Charting Explained
- Intermarket Technical Analysis
- John Murphy on Chart Analysis
- John Murphy's Chart Pattern Recognition
- John Murphy's Market Message
- MurphyExplainsMarketAnalysis-Intermarket Analysis
- MurphyExplainsMarketAnalysis-Visual Analysis
- StockCharts.com
- Technical Analysis of the Financial Markets
- The Visual Investor
