HOT TOPICS LIST
- MACD
- Fibonacci
- RSI
- Gann
- ADXR
- Stochastics
- Volume
- Triangles
- Futures
- Cycles
- Volatility
- ZIGZAG
- MESA
- Retracement
- Aroon
INDICATORS LIST
LIST OF TOPICS
PRINT THIS ARTICLE
by David Penn
As the advance in oil prices stalls, oil service stocks move to the low end of a trend channel that has contained prices for months.
Position: N/A
David Penn
Technical Writer for Technical Analysis of STOCKS & COMMODITIES magazine, Working-Money.com, and Traders.com Advantage.
PRINT THIS ARTICLE
TREND-CHANNEL
Oil Service Stocks Test Support Of Trend Channel
06/27/07 10:36:34 AMby David Penn
As the advance in oil prices stalls, oil service stocks move to the low end of a trend channel that has contained prices for months.
Position: N/A
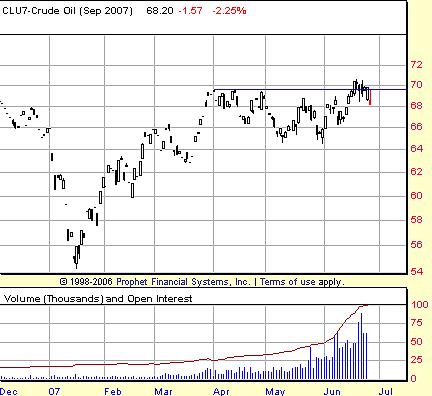
| My previous look at oil and oil stocks considered the challenge that crude oil would have in making new highs. This was in the wake of the late spring correction that saw crude oil slip from 68 to 61 (basis June). |
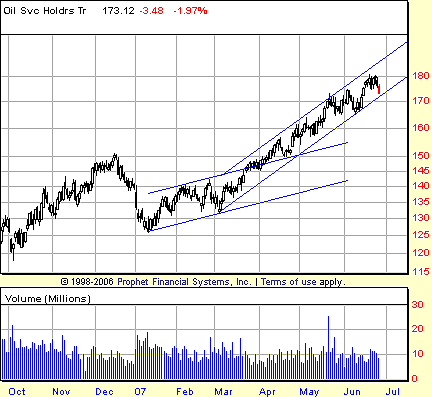
| Interestingly, oil service stocks were breaking out of an old trend channel at precisely the same time that crude oil was in a correction mode (that is, April into early May). Generally, when commodity stocks are moving higher while the commodity is correcting, traders take that for a bullish signal. Traders expect the commodity to catch up with the bullishness of the commodity stocks. |

|
| FIGURE 1: OIL SERVICE HOLDRS TRUST, DAILY. OIH developed a more aggressive uptrend in the spring of 2007 as it broke free from an initial, three-month trend channel. The new trend channel has contained OIH prices but is being tested for support late in June. |
| Graphic provided by: Prophet Financial, Inc. |
| |
| In a way, crude oil futures did catch up. By late May it looked increasingly as if a bottom had been formed in crude, and by mid-June, crude oil was back testing year-to-date highs. But that test remains to be passed insofar as crude oil set new year-to-date highs only to pull back, failing to follow through to the upside. When this happens, it often signals significant weakness on the part of the bulls. Opportunities for reversal often appear in just these situations. |

|
| FIGURE 2: CRUDE OIL, SEPTEMBER FUTURES, DAILY. Crude oil futures bottomed in May, just as shares of oil service companies were accelerating to the upside. But crude oilís failure to follow through after making new year-to-date highs combines with a pullback in oil service stocks to paint an intermediate-term bearish picture for oil and oil stocks. |
| Graphic provided by: Prophet Financial, Inc. |
| |
| With crude oil finding trouble moving higher, it is of little surprise to see oil service stocks moving back down toward the lower end of its more recent trend channel. This trend channel began when oil service stocks broke out in the spring and has contained prices in the OIH ever since. The lower boundary of this trend channel was tested once in early June and now appears to be tested again at the end of the month. |
| There are two main ways to trade a test of trendline. The first is pro-trend. Buy the market and either place a stop below the trendline or decide to exit on the first close below the lower boundary of the trend channel. The second approach is to play the potential breakdown. In this scenario, you would short the first close below the lower boundary of the trend channel. With a channel height just shy of 14, a breakdown below the trend channel could take the OIH to as low as 155. |
Technical Writer for Technical Analysis of STOCKS & COMMODITIES magazine, Working-Money.com, and Traders.com Advantage.
| Title: | Technical Writer |
| Company: | Technical Analysis, Inc. |
| Address: | 4757 California Avenue SW |
| Seattle, WA 98116 | |
| Phone # for sales: | 206 938 0570 |
| Fax: | 206 938 1307 |
| Website: | www.Traders.com |
| E-mail address: | DPenn@traders.com |
Traders' Resource Links | |
| Charting the Stock Market: The Wyckoff Method -- Books | |
| Working-Money.com -- Online Trading Services | |
| Traders.com Advantage -- Online Trading Services | |
| Technical Analysis of Stocks & Commodities -- Publications and Newsletters | |
| Working Money, at Working-Money.com -- Publications and Newsletters | |
| Traders.com Advantage -- Publications and Newsletters | |
| Professional Traders Starter Kit -- Software | |
Click here for more information about our publications!
PRINT THIS ARTICLE

Request Information From Our Sponsors
- VectorVest, Inc.
- Executive Premier Workshop
- One-Day Options Course
- OptionsPro
- Retirement Income Workshop
- Sure-Fire Trading Systems (VectorVest, Inc.)
- Trading as a Business Workshop
- VectorVest 7 EOD
- VectorVest 7 RealTime/IntraDay
- VectorVest AutoTester
- VectorVest Educational Services
- VectorVest OnLine
- VectorVest Options Analyzer
- VectorVest ProGraphics v6.0
- VectorVest ProTrader 7
- VectorVest RealTime Derby Tool
- VectorVest Simulator
- VectorVest Variator
- VectorVest Watchdog
- StockCharts.com, Inc.
- Candle Patterns
- Candlestick Charting Explained
- Intermarket Technical Analysis
- John Murphy on Chart Analysis
- John Murphy's Chart Pattern Recognition
- John Murphy's Market Message
- MurphyExplainsMarketAnalysis-Intermarket Analysis
- MurphyExplainsMarketAnalysis-Visual Analysis
- StockCharts.com
- Technical Analysis of the Financial Markets
- The Visual Investor
