HOT TOPICS LIST
- MACD
- Fibonacci
- RSI
- Gann
- ADXR
- Stochastics
- Volume
- Triangles
- Futures
- Cycles
- Volatility
- ZIGZAG
- MESA
- Retracement
- Aroon
INDICATORS LIST
LIST OF TOPICS
PRINT THIS ARTICLE
by David Penn
Are falling silver prices anticipating a deflationary shock?
Position: N/A
David Penn
Technical Writer for Technical Analysis of STOCKS & COMMODITIES magazine, Working-Money.com, and Traders.com Advantage.
PRINT THIS ARTICLE
SUPPORT & RESISTANCE
A Whiff Of Deflation
06/26/07 02:20:47 PMby David Penn
Are falling silver prices anticipating a deflationary shock?
Position: N/A
| A few months ago in Working-Money.com, I suggested that the crescendo of inflation-mongering in the popular financial press was good reason to take a close look at the other side of that bet. What does the other side of that bet consist of? Among other things, a rising US dollar and falling prices for precious metals. |

|
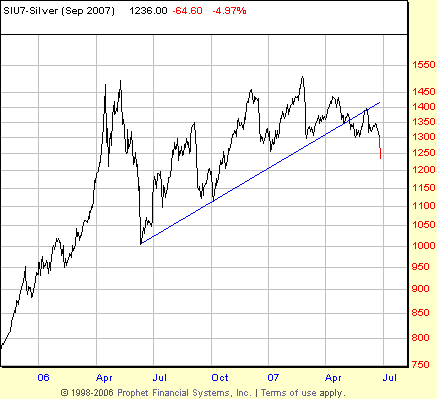
| FIGURE 1: SILVER, SEPTEMBER FUTURES, DAILY. A break below a major trendline shows follow-through to the downside after a brief bounce that tested the former support line for resistance. |
| Graphic provided by: Prophet Financial, Inc. |
| |
| My suspicion of the gold rally (documented in Traders.com Advantage articles such as "Gold Meets Resistance" from April 25, 2007) has led me to anticipate a break in precious metals sooner than later. And while it took longer than I thought, my lower-before-higher thesis appears to be materializing, especially in assets like silver. |
| There are a number of ways to look at the breakdown in silver — and all of them are particularly bearish. The chart of September silver in Figure 1 is a line chart because the candlestick chart over the time frame was a little discontinuous. The line chart makes it easy to see how prices for September silver plunged late in the second quarter of 2007. |
| This move lower comes after an initial break below a major trendline that extends back almost a year. Silver prices bounced shortly after breaking the support line, testing that same trendline for resistance before failing to move higher and, instead, reversing and moving lower. |
| The move lower in September silver not only sets a new low for the second quarter of 2007, but also looks to set a new low for the year. In fact, by breaking below the $12.50 level, September silver's next clear support does not appear until the $11.00 level. This would match the low of the early part of the fourth quarter of 2006 — as well as representing a major retracement of the rally from the correction low in the second quarter of 2006. |
Technical Writer for Technical Analysis of STOCKS & COMMODITIES magazine, Working-Money.com, and Traders.com Advantage.
| Title: | Technical Writer |
| Company: | Technical Analysis, Inc. |
| Address: | 4757 California Avenue SW |
| Seattle, WA 98116 | |
| Phone # for sales: | 206 938 0570 |
| Fax: | 206 938 1307 |
| Website: | www.Traders.com |
| E-mail address: | DPenn@traders.com |
Traders' Resource Links | |
| Charting the Stock Market: The Wyckoff Method -- Books | |
| Working-Money.com -- Online Trading Services | |
| Traders.com Advantage -- Online Trading Services | |
| Technical Analysis of Stocks & Commodities -- Publications and Newsletters | |
| Working Money, at Working-Money.com -- Publications and Newsletters | |
| Traders.com Advantage -- Publications and Newsletters | |
| Professional Traders Starter Kit -- Software | |
Click here for more information about our publications!
PRINT THIS ARTICLE

Request Information From Our Sponsors
- VectorVest, Inc.
- Executive Premier Workshop
- One-Day Options Course
- OptionsPro
- Retirement Income Workshop
- Sure-Fire Trading Systems (VectorVest, Inc.)
- Trading as a Business Workshop
- VectorVest 7 EOD
- VectorVest 7 RealTime/IntraDay
- VectorVest AutoTester
- VectorVest Educational Services
- VectorVest OnLine
- VectorVest Options Analyzer
- VectorVest ProGraphics v6.0
- VectorVest ProTrader 7
- VectorVest RealTime Derby Tool
- VectorVest Simulator
- VectorVest Variator
- VectorVest Watchdog
- StockCharts.com, Inc.
- Candle Patterns
- Candlestick Charting Explained
- Intermarket Technical Analysis
- John Murphy on Chart Analysis
- John Murphy's Chart Pattern Recognition
- John Murphy's Market Message
- MurphyExplainsMarketAnalysis-Intermarket Analysis
- MurphyExplainsMarketAnalysis-Visual Analysis
- StockCharts.com
- Technical Analysis of the Financial Markets
- The Visual Investor
