HOT TOPICS LIST
- MACD
- Fibonacci
- RSI
- Gann
- ADXR
- Stochastics
- Volume
- Triangles
- Futures
- Cycles
- Volatility
- ZIGZAG
- MESA
- Retracement
- Aroon
INDICATORS LIST
LIST OF TOPICS
PRINT THIS ARTICLE
by David Penn
Dropping beneath a four-month trendline and its 50-day moving average, the Nikkei 225 Index just keeps falling, and falling, and falling . . .
Position: N/A
David Penn
Technical Writer for Technical Analysis of STOCKS & COMMODITIES magazine, Working-Money.com, and Traders.com Advantage.
PRINT THIS ARTICLE
TECHNICAL ANALYSIS
The Nikkei Nosedive
12/21/00 02:49:19 PMby David Penn
Dropping beneath a four-month trendline and its 50-day moving average, the Nikkei 225 Index just keeps falling, and falling, and falling . . .
Position: N/A
| For all those looking to the Nasdaq with longing for performances past, take heart. You could be one of those sad salmon trying to swim upstream against an even mightier current: the 10-year secular bear market of Japan's Nikkei 225 Index. |
| How mighty? From a peak of 39,000 in 1990, the Nikkei has fallen to a close of 13,770 as of December 21st, a decline of about 65%. For some time, the 14,000 level was thought of in much the same way as the 3,000 level of the Nasdaq: a line of death, a stiff and resilient platform of resistance. And like the 3,000 level of the Nasdaq, the Nikkei's 14,000 level eventually was penetrated; here, in decidedly bearish late December trading. |

|
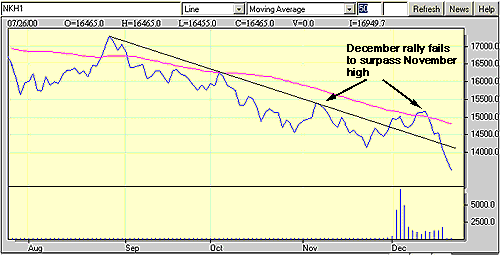
| When is a ten-year low a bottom? Don't ask the Nikkei 225 Index, which has underperformed its own 50-day moving average during most of 2000, and recently fell beneath a four-month trendline. |
| Graphic provided by: TradeStation. |
| |
| The bearishness of the Nikkei 225 is made all the more plain by comparing the price action of the Nikkei index futures to both a downward, four-month trendline--a trendline that has resisted all but the strongest, high volume, upside moves--as well as a 50-day moving average, which the index has underperformed for most of the autumn and into the end of the year. The trend line connects the August, October and November highs with no breakouts (even intraday ones) until the "false bottom" in late November. The Nikkei rallied into December, challenging the November highs on two separate occasions. However, the November high of 15,300 proved too formidable and the correction was swift: Nikkei 225 index futures fell from their December high of 15,130 to their all-time low of 13,770, a drop of 9%. |
| Compared to its 50-day moving average, the Nikkei 225 Index has done even worse. While the index moved upside of the average in late August, and made a strong run on the average in early October, the index underperformed the average significantly over the course of October and November. And, as with the trendline breakout in late November, the Nikkei index broke out over its 50-day moving average for about three trading sessions in December before once again succumbing to the bear. |
| Playing the short side of the Nikkei 225 (is there a long side to this market?), there are a number of reasonable stop-buy points in the event that the Nikkei does the unthinkable and actually finds a bottom in the near future. The November low of 14,140 is among the closer reference points, and a stop just ticks above this mark could allow for a small rally of about 3% from the current point. A wider stop could be reasonably put in the area of the contract's December high of 15,160. This would allow for a rally of as much as 10% before being stopped out. |
Technical Writer for Technical Analysis of STOCKS & COMMODITIES magazine, Working-Money.com, and Traders.com Advantage.
| Title: | Technical Writer |
| Company: | Technical Analysis, Inc. |
| Address: | 4757 California Avenue SW |
| Seattle, WA 98116 | |
| Phone # for sales: | 206 938 0570 |
| Fax: | 206 938 1307 |
| Website: | www.Traders.com |
| E-mail address: | DPenn@traders.com |
Traders' Resource Links | |
| Charting the Stock Market: The Wyckoff Method -- Books | |
| Working-Money.com -- Online Trading Services | |
| Traders.com Advantage -- Online Trading Services | |
| Technical Analysis of Stocks & Commodities -- Publications and Newsletters | |
| Working Money, at Working-Money.com -- Publications and Newsletters | |
| Traders.com Advantage -- Publications and Newsletters | |
| Professional Traders Starter Kit -- Software | |
Click here for more information about our publications!
Comments
Date: / /Rank: 4Comment:

Request Information From Our Sponsors
- StockCharts.com, Inc.
- Candle Patterns
- Candlestick Charting Explained
- Intermarket Technical Analysis
- John Murphy on Chart Analysis
- John Murphy's Chart Pattern Recognition
- John Murphy's Market Message
- MurphyExplainsMarketAnalysis-Intermarket Analysis
- MurphyExplainsMarketAnalysis-Visual Analysis
- StockCharts.com
- Technical Analysis of the Financial Markets
- The Visual Investor
- VectorVest, Inc.
- Executive Premier Workshop
- One-Day Options Course
- OptionsPro
- Retirement Income Workshop
- Sure-Fire Trading Systems (VectorVest, Inc.)
- Trading as a Business Workshop
- VectorVest 7 EOD
- VectorVest 7 RealTime/IntraDay
- VectorVest AutoTester
- VectorVest Educational Services
- VectorVest OnLine
- VectorVest Options Analyzer
- VectorVest ProGraphics v6.0
- VectorVest ProTrader 7
- VectorVest RealTime Derby Tool
- VectorVest Simulator
- VectorVest Variator
- VectorVest Watchdog
