HOT TOPICS LIST
- MACD
- Fibonacci
- RSI
- Gann
- ADXR
- Stochastics
- Volume
- Triangles
- Futures
- Cycles
- Volatility
- ZIGZAG
- MESA
- Retracement
- Aroon
INDICATORS LIST
LIST OF TOPICS
PRINT THIS ARTICLE
by Chaitali Mohile
The symmetrical triangle on the $XAU chart is likely to contract the Index range.
Position: N/A
Chaitali Mohile
Active trader in the Indian stock markets since 2003 and a full-time writer. Trading is largely based upon technical analysis.
PRINT THIS ARTICLE
CHART ANALYSIS
Gold & Silver Index Move In Narrower Range
06/29/07 03:22:54 PMby Chaitali Mohile
The symmetrical triangle on the $XAU chart is likely to contract the Index range.
Position: N/A
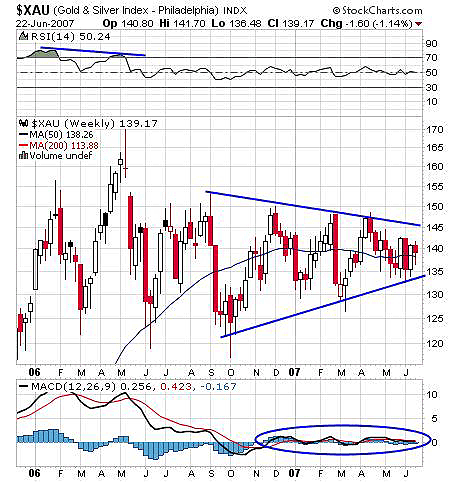
| The Gold & Silver Index ($XAU) has been undergoing a highly volatile session since May 2006 with a high of 170. The downward journey of the index began with the negative divergence on the relative strength index (RSI) (14) against the higher high made on the price chart. The lowermost and strongest support was around 125 level, and this support was tested many times during the volatile rally. The lower highs and higher lows further narrowed the rally, forming a symmetrical triangle on the weekly chart (Figure 1). As the triangle reaches the maturity level, the upper resistance line and the lower support will move closer, tightening the rally further. In Figure 1, the 145 level is the resistance and 135 is the support level to be observed. Trades may get trapped in this 10-point range. Below 135, the 125 level will be the major support. |
| The moving average convergence/divergence (MACD)(12, 26, 9) is also showing a volatile run. The indicator has been moving very close to its trigger line, but the fact that it has sustained above the zero line is a positive sign. The RSI (14) is indicating bullish strength with a support level of 50. |

|
| FIGURE 1: $XAU, WEEKLY. The symmetrical triangle formed can narrow the index movement further. |
| Graphic provided by: StockCharts.com. |
| |
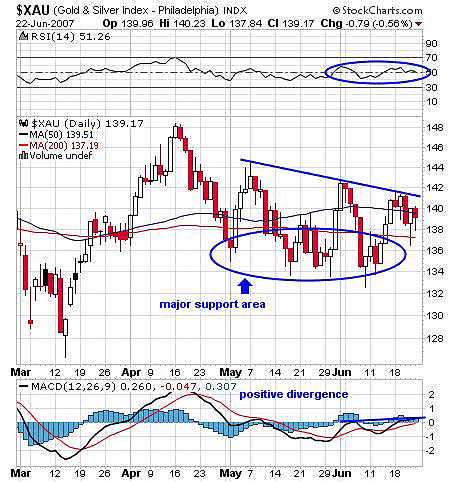
| In Figure 2, the 134-135 level is seen as major support throughout the rally. The index in its range-bound move of 134-144 established the support level at the 200-day moving average and the 50-day moving average. Currently, $XAU stands on the 50-day moving average support and is ready to move toward its upper resistance, as indicated by drawing the trendline. On the daily chart (Figure 2), the levels to be watched are 142 (resistance), the 200-day moving average as first support, and 134 as final support. The MACD (12, 26, 9) is showing a positive divergence, so some kind of bullish rally can be expected. The ultimate upper resistance of 145 in the weekly chart can be marked during the bullish rally. |

|
| FIGURE 2: $XAU, DAILY. The positive divergence in the MACD (12, 26, 9) may result in a marginal bullish rally. |
| Graphic provided by: StockCharts.com. |
| |
| Thus, the symmetrical triangle on Figure 1 and the trendline resistance on Figure 2 are indicating a narrow range in the Gold & Silver Index. The maximum 10-point range is a high-risk trade, though both indicators on the charts are bullish. |
Active trader in the Indian stock markets since 2003 and a full-time writer. Trading is largely based upon technical analysis.
| Company: | Independent |
| Address: | C1/3 Parth Indraprasth Towers. Vastrapur |
| Ahmedabad, Guj 380015 | |
| E-mail address: | chaitalimohile@yahoo.co.in |
Traders' Resource Links | |
| Independent has not added any product or service information to TRADERS' RESOURCE. | |
Click here for more information about our publications!
PRINT THIS ARTICLE

Request Information From Our Sponsors
- StockCharts.com, Inc.
- Candle Patterns
- Candlestick Charting Explained
- Intermarket Technical Analysis
- John Murphy on Chart Analysis
- John Murphy's Chart Pattern Recognition
- John Murphy's Market Message
- MurphyExplainsMarketAnalysis-Intermarket Analysis
- MurphyExplainsMarketAnalysis-Visual Analysis
- StockCharts.com
- Technical Analysis of the Financial Markets
- The Visual Investor
- VectorVest, Inc.
- Executive Premier Workshop
- One-Day Options Course
- OptionsPro
- Retirement Income Workshop
- Sure-Fire Trading Systems (VectorVest, Inc.)
- Trading as a Business Workshop
- VectorVest 7 EOD
- VectorVest 7 RealTime/IntraDay
- VectorVest AutoTester
- VectorVest Educational Services
- VectorVest OnLine
- VectorVest Options Analyzer
- VectorVest ProGraphics v6.0
- VectorVest ProTrader 7
- VectorVest RealTime Derby Tool
- VectorVest Simulator
- VectorVest Variator
- VectorVest Watchdog
