HOT TOPICS LIST
- MACD
- Fibonacci
- RSI
- Gann
- ADXR
- Stochastics
- Volume
- Triangles
- Futures
- Cycles
- Volatility
- ZIGZAG
- MESA
- Retracement
- Aroon
INDICATORS LIST
LIST OF TOPICS
PRINT THIS ARTICLE
by Koos van der Merwe
The first rule in Elliott wave analysis? The wave count must look right.
Position: Accumulate
Koos van der Merwe
Has been a technical analyst since 1969, and has worked as a futures and options trader with First Financial Futures in Johannesburg, South Africa.
PRINT THIS ARTICLE
ELLIOTT WAVE
An Elliott Wave Look At The Canadian Income Trust Index
06/27/07 09:58:17 AMby Koos van der Merwe
The first rule in Elliott wave analysis? The wave count must look right.
Position: Accumulate
| The first rule of Elliott wave analysis is: 1. The wave count must look right. The other rules are: 2. Wave 3 must be greater than wave 1. 3. Wave 4 is equal to wave 2. 4. If wave 2 is a simple wave, then wave 4 should be a complicated wave, and vice versa. 5. Wave 5 is equal in length to wave 1. 6. The end of the ABC correction should be with the fourth wave of lesser degree. These are the basic rules. Others have appeared over the years — for example if wave 3 happens to be less than wave 1, then wave 5 must be less than wave 3, but if one accepts the six original basics, then a wave count identifying an Elliott wave becomes quite simple. |

|
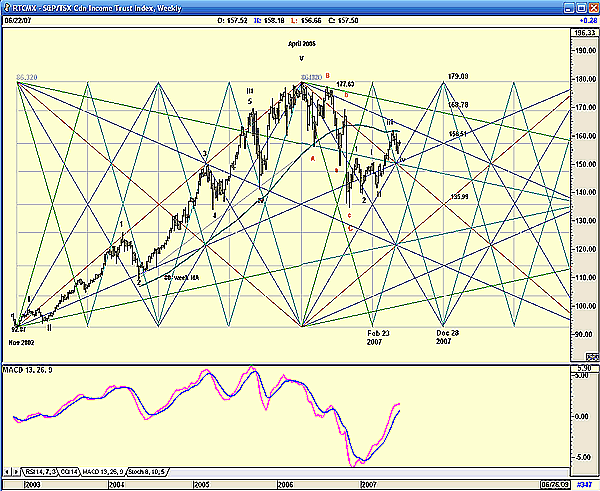
| FIGURE 1: RTCMX, WEEKLY. Note the classic wave count. |
| Graphic provided by: AdvancedGET. |
| |
| When you look at Figure 1, a chart of the Canadian Income Trust Index, note how classic the wave count is, with a perfect wave 5 up and the ABC correction down, correcting at the bottom end of the fourth wave of lesser degree ( the low of wave 4). To better analyze the chart, I have added Gann squares, which includes Gann fans. The retracement of the ABC correction was a 50% retracement of the rise from November 2002 to the high of April 2006, as shown on the chart. Note too how the price consolidated at line 6 of the rule of eights, where the range from the high to the low is divided into eight areas as shown. The price then moved higher but found consolidation at line 7, where it appears to be completing a iv wave of wave i of wave 1. This does suggest that we could see a rise to the next resistance/consolidation level of 168.78, line 8 of the rule of eights. This would complete wave 3, suggesting that wave 5 could test the 179.08 level. Will this pattern trace out as suggested? I have often written that it is my opinion that the Elliott wave formation is more a signpost telling us, "This is where you are." As a forecasting target tool, there are indicators that are far better, but wave theory is a very important tool in our quivers, as long as simplicity is paramount. It is when we look for complicated wave counts that it becomes difficult to tell you where we are. Finally, look at the the moving average convergence/divergence (MACD) shown. This is my indicator of choice when analyzing charts using Elliott waves. I have learned never to anticipate a buy or sell signal rather wait for the actual crossing of the two lines to occur. |
Has been a technical analyst since 1969, and has worked as a futures and options trader with First Financial Futures in Johannesburg, South Africa.
| Address: | 3256 West 24th Ave |
| Vancouver, BC | |
| Phone # for sales: | 6042634214 |
| E-mail address: | petroosp@gmail.com |
Click here for more information about our publications!
PRINT THIS ARTICLE

Request Information From Our Sponsors
- StockCharts.com, Inc.
- Candle Patterns
- Candlestick Charting Explained
- Intermarket Technical Analysis
- John Murphy on Chart Analysis
- John Murphy's Chart Pattern Recognition
- John Murphy's Market Message
- MurphyExplainsMarketAnalysis-Intermarket Analysis
- MurphyExplainsMarketAnalysis-Visual Analysis
- StockCharts.com
- Technical Analysis of the Financial Markets
- The Visual Investor
- VectorVest, Inc.
- Executive Premier Workshop
- One-Day Options Course
- OptionsPro
- Retirement Income Workshop
- Sure-Fire Trading Systems (VectorVest, Inc.)
- Trading as a Business Workshop
- VectorVest 7 EOD
- VectorVest 7 RealTime/IntraDay
- VectorVest AutoTester
- VectorVest Educational Services
- VectorVest OnLine
- VectorVest Options Analyzer
- VectorVest ProGraphics v6.0
- VectorVest ProTrader 7
- VectorVest RealTime Derby Tool
- VectorVest Simulator
- VectorVest Variator
- VectorVest Watchdog
