

HOT TOPICS LIST
- MACD
- Fibonacci
- RSI
- Gann
- ADXR
- Stochastics
- Volume
- Triangles
- Futures
- Cycles
- Volatility
- ZIGZAG
- MESA
- Retracement
- Aroon
INDICATORS LIST
LIST OF TOPICS
PRINT THIS ARTICLE
by Koos van der Merwe
South Africa and gold are synonymous, and the share price has responded accordingly. Is it justified?
Position: Accumulate
Koos van der Merwe
Has been a technical analyst since 1969, and has worked as a futures and options trader with First Financial Futures in Johannesburg, South Africa.
PRINT THIS ARTICLE
OSCILL1 - OSCILL2
Is Serengeti Resources Buying A Hole Of Hope?
06/26/07 12:03:24 PMby Koos van der Merwe
South Africa and gold are synonymous, and the share price has responded accordingly. Is it justified?
Position: Accumulate
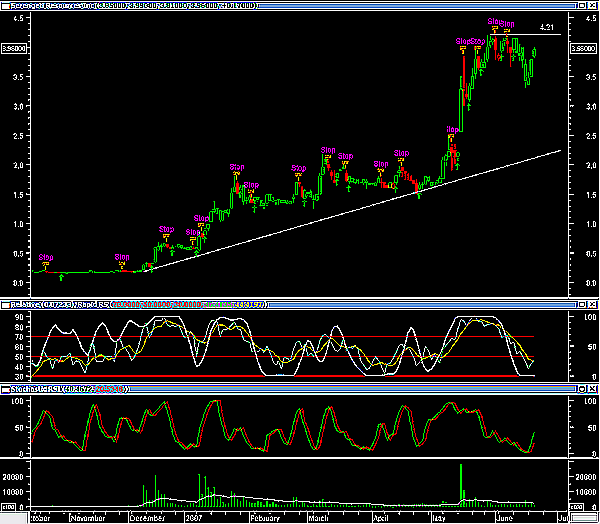
| Serengeti Resources is a mineral exploration company focused on the discovery of copper, gold, and molybdenum deposits in British Columbia. The name "Serengeti" can be confusing especially to investors from South Africa, because the Serengeti Game Reserve in Botswana is one of the most beautiful in the world. The name therefore implies a South African affiliation, and as everyone knows, South Africa and gold are synonymous. Figure 1 is a MetaStock chart showing the indicators that give me the buy signal for the share. |
|
| FIGURE 1: SERENGETI. Serengeti and its indicators suggest a buy signal. |
| Graphic provided by: MetaStock. |
| |
| Figure 1 shows the following: 1. Candlestick bars show how the price moved up strongly on small volume over the past three days. This is a sign of weakness and not strength, contrary to the other indicators. 2. The main support line, and a resistance line at the $4.21 level. 3. Stop signals. These signals are generated by using the PS Pattern Trading System 1 of the Expert Advisor offered by MetaStock. The arrows are the buy signals given, and the stop signals would be the sell signals. I use them to highlight possible sells rather than act on them. 4. The relative strength spread and rapid RSI, both signals available in recent editions of Technical Analysis of STOCKS & COMMODITIES. I like the indicators and use them as a guide in my decision making. The rapid RSI is suggesting a buy signal. 5. The stochastic RSI, which is the main indicator I use to confirm a buy or sell signal. The signal has given a buy signal. 6. Volume. Here I have added a 22-period exponential moving average (white line). The volume is still below the moving average, showing that although a buy signal has been suggested by two of the indicators I watch, the signals have been given on low volume. My second chart is an Advanced GET chart. |
|
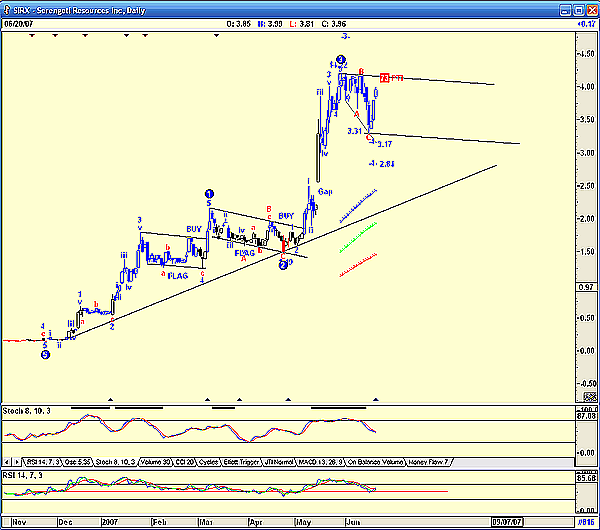
| FIGURE 2: SERENGETI. Serengeti with an Elliott wave count. |
| Graphic provided by: AdvancedGET. |
| |
| Figure 2 shows the two flags that preceded the rise to the high of $4.22 before the retracement to $3.31. The share price appears to be tracing a trumpet pattern, a broadening triangle, which is considered to be an unreliable formation. The price could test the upper trendline, and hence the buy signal given in my MetaStock chart, before falling back to find support on the lower trendline. This will form another flag, forecasting a new high of approximately $6.00 (4.22 - 1.49 = 2.73 + 3.31 = 6.04). My two preferred indicators are the stochastic (8, 10, 3) and the relative strength index (RSI). The stochastic indicator is suggesting further weakness, but the RSI appears to be using the 50 horizontal line as a buy signal. Finally, Advanced GET's Elliott wave count is suggesting that the chart is retracing a wave 4 and shows the two possible target levels, the one at $3.17 and the other at $2.84. The PTI is 73, suggesting that the probability of the wave count being true is 75%. |
| Serengeti is a heavily promoted stock at the moment, and the price has responded accordingly. The company is an exploration company, which means that one would be buying "holes of hope," but the charts are suggesting that the gamble does appear to be justified. |
Has been a technical analyst since 1969, and has worked as a futures and options trader with First Financial Futures in Johannesburg, South Africa.
| Address: | 3256 West 24th Ave |
| Vancouver, BC | |
| Phone # for sales: | 6042634214 |
| E-mail address: | petroosp@gmail.com |
Click here for more information about our publications!
PRINT THIS ARTICLE

Request Information From Our Sponsors
- VectorVest, Inc.
- Executive Premier Workshop
- One-Day Options Course
- OptionsPro
- Retirement Income Workshop
- Sure-Fire Trading Systems (VectorVest, Inc.)
- Trading as a Business Workshop
- VectorVest 7 EOD
- VectorVest 7 RealTime/IntraDay
- VectorVest AutoTester
- VectorVest Educational Services
- VectorVest OnLine
- VectorVest Options Analyzer
- VectorVest ProGraphics v6.0
- VectorVest ProTrader 7
- VectorVest RealTime Derby Tool
- VectorVest Simulator
- VectorVest Variator
- VectorVest Watchdog
- StockCharts.com, Inc.
- Candle Patterns
- Candlestick Charting Explained
- Intermarket Technical Analysis
- John Murphy on Chart Analysis
- John Murphy's Chart Pattern Recognition
- John Murphy's Market Message
- MurphyExplainsMarketAnalysis-Intermarket Analysis
- MurphyExplainsMarketAnalysis-Visual Analysis
- StockCharts.com
- Technical Analysis of the Financial Markets
- The Visual Investor