

HOT TOPICS LIST
- MACD
- Fibonacci
- RSI
- Gann
- ADXR
- Stochastics
- Volume
- Triangles
- Futures
- Cycles
- Volatility
- ZIGZAG
- MESA
- Retracement
- Aroon
INDICATORS LIST
LIST OF TOPICS
PRINT THIS ARTICLE
by Arthur Hill
Fairchild Semiconductor is showing good relative strength, and a recent breakout points to higher prices in the coming weeks.
Position: Accumulate
Arthur Hill
Arthur Hill is currently editor of TDTrader.com, a website specializing in trading strategies, sector/industry specific breadth stats and overall technical analysis. He passed the Society of Technical Analysts (STA London) diploma exam with distinction is a Certified Financial Technician (CFTe). Prior to TD Trader, he was the Chief Technical Analyst for Stockcharts.com and the main contributor to the ChartSchool.
PRINT THIS ARTICLE
CUP WITH HANDLE
A Cup With Handle Breakout For Fairchild
06/22/07 09:03:48 AMby Arthur Hill
Fairchild Semiconductor is showing good relative strength, and a recent breakout points to higher prices in the coming weeks.
Position: Accumulate
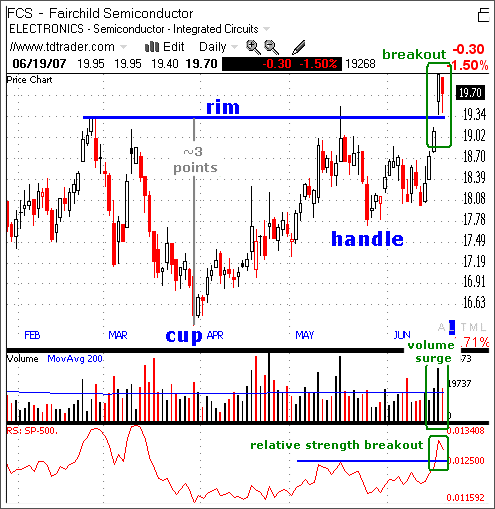
| On the daily chart (Figure 1), Fairchild Semiconductor (FCS) swooned in March and surged in April. The April surge completely made up for the March decline and the stock consolidated just below the late February high. The March decline and April advance formed the cup portion of a cup-with-handle pattern. The May–June consolidation forms the handle, and rim resistance is set around 19.3. This week's surge above 19.5 broke rim resistance and confirmed this bullish pattern. |
|
| FIGURE 1: FAIRCHILD SEMICONDUCTOR, DAILY. This stock swooned in March and surged in April. |
| Graphic provided by: Telechart 2007. |
| |
| In addition to the resistance breakout, the stock is starting to show good relative strength and strong upside volume. There were a number of high volume advances in late April and May. This continued with a high volume breakout this week. Volume validates the breakout and gives it strength. The price relative had been flat from April to early June. With the surge over the last five days, the price relative broke resistance, and FCS is now leading the market over the last few months. This price relative shows the performance of FCS against the Standard & Poor's 500. |
| Based on the cup-with-handle breakout, the upside projection is to around 22. The distance from the low of the cup to rim resistance is around 3 points, and this is added to the breakout. The breakout occurred at 19.3 and 3 points from there would target a move to around 22.3. The April 2006 high is at 21.95 and this marks resistance around 22. The cup-with-handle target and resistance point to 22. |
Arthur Hill is currently editor of TDTrader.com, a website specializing in trading strategies, sector/industry specific breadth stats and overall technical analysis. He passed the Society of Technical Analysts (STA London) diploma exam with distinction is a Certified Financial Technician (CFTe). Prior to TD Trader, he was the Chief Technical Analyst for Stockcharts.com and the main contributor to the ChartSchool.
| Title: | Editor |
| Company: | TDTrader.com |
| Address: | Willem Geetsstraat 17 |
| Mechelen, B2800 | |
| Phone # for sales: | 3215345465 |
| Website: | www.tdtrader.com |
| E-mail address: | arthurh@tdtrader.com |
Traders' Resource Links | |
| TDTrader.com has not added any product or service information to TRADERS' RESOURCE. | |
Click here for more information about our publications!
PRINT THIS ARTICLE

Request Information From Our Sponsors
- VectorVest, Inc.
- Executive Premier Workshop
- One-Day Options Course
- OptionsPro
- Retirement Income Workshop
- Sure-Fire Trading Systems (VectorVest, Inc.)
- Trading as a Business Workshop
- VectorVest 7 EOD
- VectorVest 7 RealTime/IntraDay
- VectorVest AutoTester
- VectorVest Educational Services
- VectorVest OnLine
- VectorVest Options Analyzer
- VectorVest ProGraphics v6.0
- VectorVest ProTrader 7
- VectorVest RealTime Derby Tool
- VectorVest Simulator
- VectorVest Variator
- VectorVest Watchdog
- StockCharts.com, Inc.
- Candle Patterns
- Candlestick Charting Explained
- Intermarket Technical Analysis
- John Murphy on Chart Analysis
- John Murphy's Chart Pattern Recognition
- John Murphy's Market Message
- MurphyExplainsMarketAnalysis-Intermarket Analysis
- MurphyExplainsMarketAnalysis-Visual Analysis
- StockCharts.com
- Technical Analysis of the Financial Markets
- The Visual Investor