HOT TOPICS LIST
- MACD
- Fibonacci
- RSI
- Gann
- ADXR
- Stochastics
- Volume
- Triangles
- Futures
- Cycles
- Volatility
- ZIGZAG
- MESA
- Retracement
- Aroon
INDICATORS LIST
LIST OF TOPICS
PRINT THIS ARTICLE
by Koos van der Merwe
We should stick to the rules.
Position: Accumulate
Koos van der Merwe
Has been a technical analyst since 1969, and has worked as a futures and options trader with First Financial Futures in Johannesburg, South Africa.
PRINT THIS ARTICLE
ELLIOTT WAVE
So What IS The True Elliott Wave Count?
06/26/07 09:10:23 AMby Koos van der Merwe
We should stick to the rules.
Position: Accumulate
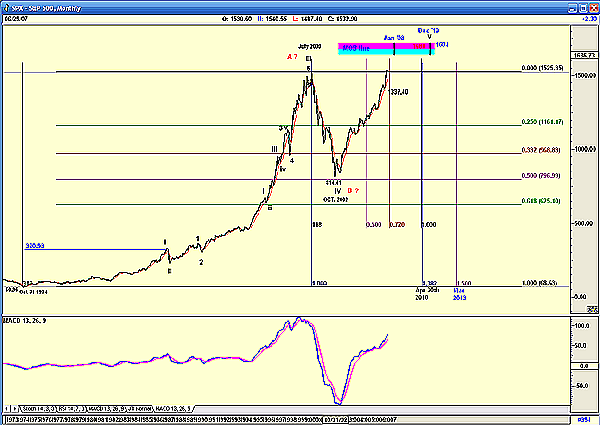
| The most important rule of Elliott wave analysis is "The wave structure must look right." It is because of this rule — one that I ignored when I believed the Standard & Poor's 500 was in a B-wave upward — that I changed my outlook about the wave count. In Figure 1, I have shown my original wave count in red with a question mark. My new wave count suggests that what I believed was a B-wave could be the beginnings of a wave V. |

|
| FIGURE 1: S&P 500. This shows possible cyclical turning points. |
| Graphic provided by: AdvancedGET. |
| |
| To recap the basic wave rules: 1. The wave pattern must look right. By this I mean that wave 3 should be equal to or greater than wave 1. That waves 1 and 5 should be equal in length, and that wave 4 should fall to the fourth wave of lesser degree and be a complicated wave if wave 2 is simple, and vice versa. 2. In time, an ABC correction should be 38.2% of the rise of wave 1 to 5. This rule has been more successful in analyzing gold, but nevertheless it can be used as a guideline in determining when we can see an end to the devastating C wave. 3. Finally, in a major A-B-C wave retracement — that is, at the end of a long-term bull cycle, the A and C waves should retrace in a five-impulse wave and could retrace further than the fourth wave of lesser degree. The question arises as to whether the rise from 1974 to July 2000 is a major long-term bull cycle. To answer this question, let us look at a chart of the Dow Jones Industrial Average (DJIA) from 1890. |

|
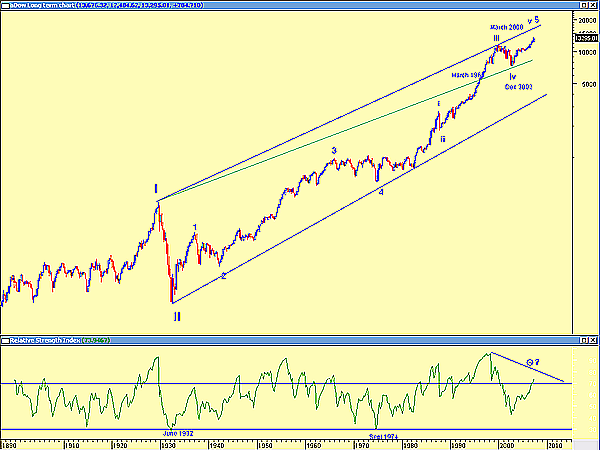
| FIGURE 2: DJIA. Here's the ultra long-term DJIA semilog chart. |
| Graphic provided by: MetaStock. |
| |
| Figure 2 is a semilog chart and clearly shows the wave I and wave II correction of the 1930s. Note how the relative strength index (RSI) became oversold and gave a buy signal. The only other time a buy signal was given was in September 1974. It is because of this that I have labeled the correction of March 2000 to December 2002 as a minor fourth-wave correction, rather than a major one. Do note the trendline drawn from the low of wave II in 1932 to the low of wave 4. A parallel line (semilog) shows that the DJIA penetrated it in March 1966 but then used the line as support for the wave-iv correction. The trendline also suggests that the wave V top could be in the 18000 region. This will be confirmed if the RSI completes a divergence top. So although in my first chart I am showing an S&P 500 chart with a wave count, the long-term chart of the DJIA is suggesting that the S&P 500 has still some way up to go, possibly to the level of 1684 as suggested by the MOB line of Advanced GET. Whereas the MOB line is suggesting a date of December 2010 as a top, the Fibonacci time line is suggesting April 2010. Returning to the chart of the S&P 500, it is now obvious that the 2000 correction is a wave 4 correction, and because of its depth, a 50% correction of the rise from 1974 to 2000, the fifth wave should not be very high. Wave 1, in fact, was only 260 points (321-61=260). Wave V has far exceeded this length. Does the wave count meet the first rule of Elliott — namely, it must look right? Yes, in my opinion it does. The chart also suggests that the major ABC correction, when it occurs, should retrace to somewhere between the high of 1966 and the low of 1974, the dates of the fourth wave of lesser degree shown on the long-term DJIA chart. |
Has been a technical analyst since 1969, and has worked as a futures and options trader with First Financial Futures in Johannesburg, South Africa.
| Address: | 3256 West 24th Ave |
| Vancouver, BC | |
| Phone # for sales: | 6042634214 |
| E-mail address: | petroosp@gmail.com |
Click here for more information about our publications!
Comments
Date: 06/26/07Rank: 1Comment:

Request Information From Our Sponsors
- StockCharts.com, Inc.
- Candle Patterns
- Candlestick Charting Explained
- Intermarket Technical Analysis
- John Murphy on Chart Analysis
- John Murphy's Chart Pattern Recognition
- John Murphy's Market Message
- MurphyExplainsMarketAnalysis-Intermarket Analysis
- MurphyExplainsMarketAnalysis-Visual Analysis
- StockCharts.com
- Technical Analysis of the Financial Markets
- The Visual Investor
- VectorVest, Inc.
- Executive Premier Workshop
- One-Day Options Course
- OptionsPro
- Retirement Income Workshop
- Sure-Fire Trading Systems (VectorVest, Inc.)
- Trading as a Business Workshop
- VectorVest 7 EOD
- VectorVest 7 RealTime/IntraDay
- VectorVest AutoTester
- VectorVest Educational Services
- VectorVest OnLine
- VectorVest Options Analyzer
- VectorVest ProGraphics v6.0
- VectorVest ProTrader 7
- VectorVest RealTime Derby Tool
- VectorVest Simulator
- VectorVest Variator
- VectorVest Watchdog
