HOT TOPICS LIST
- MACD
- Fibonacci
- RSI
- Gann
- ADXR
- Stochastics
- Volume
- Triangles
- Futures
- Cycles
- Volatility
- ZIGZAG
- MESA
- Retracement
- Aroon
INDICATORS LIST
LIST OF TOPICS
PRINT THIS ARTICLE
by Chaitali Mohile
DJ Wilshire 5000 index is facing two resistances.
Position: N/A
Chaitali Mohile
Active trader in the Indian stock markets since 2003 and a full-time writer. Trading is largely based upon technical analysis.
PRINT THIS ARTICLE
RESISTANCE LINE
DJ Wilshire 5000 May Retrace
06/27/07 01:52:57 PMby Chaitali Mohile
DJ Wilshire 5000 index is facing two resistances.
Position: N/A
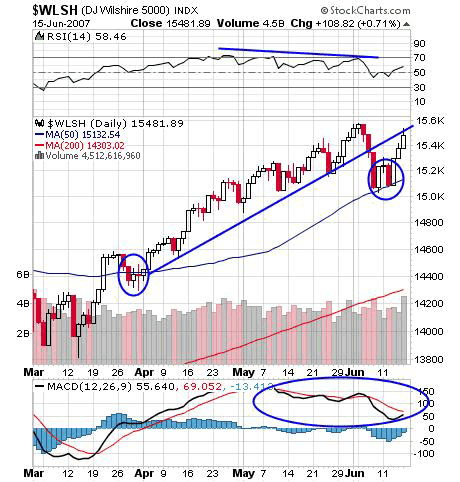
| DJ Wilshire 5000 index restarted its pullback rally in early April 2007 by violating a 50-period moving average resistance. The rally from 14600 to 15600 was joined by high volume, making the move more powerful. The index plunged again as 15600 was back and retraced to the 50-day MA support, which moved along with the rally. Like in April, the 50-day MA offered support and $WLSH rallied again. |
| But I doubt this regaining rally. First, the trendline drawn joining higher lows is likely to obstruct the bullish rally. Second, even if this trendline gets broken upward with market pressure, the immediate next resistance of the previous high stands strong. |

|
| FIGURE 1: $WLSH, DAILY. Though the bullish rally restarted with the same 50-day moving average support as before, the upside move is obstructed by the trendline and the previous high pivot. |
| Graphic provided by: StockCharts.com. |
| |
| Again, relative strength index (RSI)(14) has formed lower highs, weakening the bullish rally ahead. Eventually, lower lows in the RSI also crossed the golden level of 50, indicating the lack of bullish strength. Another indicator, the moving average convergence/divergence (MACD)(12, 26, 9) also has negative divergence on the bullish rally ahead. |
| If we were to compare the initial rally from 14600 with the rally from the 15100 level from the 50-day MA, the present move looks weak. In the previous rally, the RSI (14) moved vertically from the 30 level to a marginally overbought position, offering good trading opportunities. Even the MACD (12, 26, 9) gave a bullish crossover and surged above its zero line, strengthening the upside move. |
| Thus, looking at both indicators' current signals, violating the trendline and the previous high resistance looks difficult. The index may take a dip to accumulate the strength and then regain the rally. |
Active trader in the Indian stock markets since 2003 and a full-time writer. Trading is largely based upon technical analysis.
| Company: | Independent |
| Address: | C1/3 Parth Indraprasth Towers. Vastrapur |
| Ahmedabad, Guj 380015 | |
| E-mail address: | chaitalimohile@yahoo.co.in |
Traders' Resource Links | |
| Independent has not added any product or service information to TRADERS' RESOURCE. | |
Click here for more information about our publications!
PRINT THIS ARTICLE

Request Information From Our Sponsors
- StockCharts.com, Inc.
- Candle Patterns
- Candlestick Charting Explained
- Intermarket Technical Analysis
- John Murphy on Chart Analysis
- John Murphy's Chart Pattern Recognition
- John Murphy's Market Message
- MurphyExplainsMarketAnalysis-Intermarket Analysis
- MurphyExplainsMarketAnalysis-Visual Analysis
- StockCharts.com
- Technical Analysis of the Financial Markets
- The Visual Investor
- VectorVest, Inc.
- Executive Premier Workshop
- One-Day Options Course
- OptionsPro
- Retirement Income Workshop
- Sure-Fire Trading Systems (VectorVest, Inc.)
- Trading as a Business Workshop
- VectorVest 7 EOD
- VectorVest 7 RealTime/IntraDay
- VectorVest AutoTester
- VectorVest Educational Services
- VectorVest OnLine
- VectorVest Options Analyzer
- VectorVest ProGraphics v6.0
- VectorVest ProTrader 7
- VectorVest RealTime Derby Tool
- VectorVest Simulator
- VectorVest Variator
- VectorVest Watchdog
