HOT TOPICS LIST
- MACD
- Fibonacci
- RSI
- Gann
- ADXR
- Stochastics
- Volume
- Triangles
- Futures
- Cycles
- Volatility
- ZIGZAG
- MESA
- Retracement
- Aroon
INDICATORS LIST
LIST OF TOPICS
PRINT THIS ARTICLE
by Chaitali Mohile
A rising wedge and negative divergence indicates a reverse in a bullish rally.
Position: N/A
Chaitali Mohile
Active trader in the Indian stock markets since 2003 and a full-time writer. Trading is largely based upon technical analysis.
PRINT THIS ARTICLE
WEDGE FORMATIONS
Russell 2000 Gives Bearish Indications
06/26/07 03:37:25 PMby Chaitali Mohile
A rising wedge and negative divergence indicates a reverse in a bullish rally.
Position: N/A
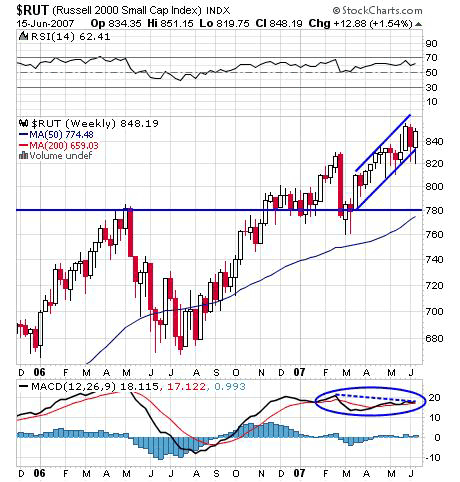
| $RUT (Russell 2000 Small-Cap Index) formed a rising wedge after a single-week drop of around 50 points in March 2007. The index then consolidated with support of a previous high pivot for two weeks and then rallied upward, forming a rising wedge. A rising wedge is a bearish indication and can lead to a temporary halt in an upside rally. In Figure 1, the rising wedge has almost matured. The lower line support was held strongly, while the entire market force was volatile. |

|
| FIGURE 1: $RUT, WEEKLY. A rising wedge formed that would result in a dip toward the support of the 780 level. |
| Graphic provided by: StockCharts.com. |
| |
| The prior high pivot at the 780 level offered support to three months' narrow consolidation at the end of 2006 and the beginning of 2007. Then as mentioned, the fourth support was in March 2007. So the horizontal line will act as a major support. If this line is violated with a rising wedge breakout, traders can see a more serious correction in the index. But at the current scenario, traders can just watch for a breakout for a rising wedge below 820. |
| Moving average convergence/divergence (MACD) (12, 26, 9) has formed lower highs as opposed to higher highs. This forms a negative divergence in MACD (12, 26, 9) in Figure 1. This enhances the possibilities of a correction below the horizontal support line. The relative strength index (RSI)(14) has been moving in a 50-65 range for a longer period, leading to a bullish but volatile rally in the index. |

|
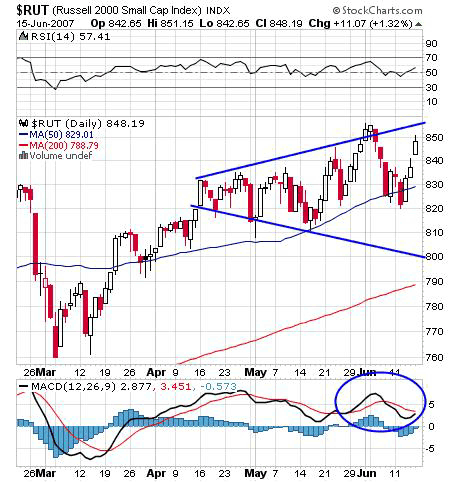
| FIGURE 2: $RUT, DAILY. An expanding triangle indicates a long-term trend change. |
| Graphic provided by: StockCharts.com. |
| |
| An expanding or broadening triangle is considered a reversal for a long-term trend. In Figure 2, Russell 2000 tried to breach the upper resistance line but failed and drifted to a 50-day moving average support. Now the index is again very close to an upper trendline. The MACD (12, 26, 9) is still negative but turned up for a bullish crossover. |
| Traders can stay on the sideline from a bullish position on this index stock. Profit booking can be a better option than going for any trade. |
Active trader in the Indian stock markets since 2003 and a full-time writer. Trading is largely based upon technical analysis.
| Company: | Independent |
| Address: | C1/3 Parth Indraprasth Towers. Vastrapur |
| Ahmedabad, Guj 380015 | |
| E-mail address: | chaitalimohile@yahoo.co.in |
Traders' Resource Links | |
| Independent has not added any product or service information to TRADERS' RESOURCE. | |
Click here for more information about our publications!
Comments
Date: 06/26/07Rank: 1Comment:

Request Information From Our Sponsors
- StockCharts.com, Inc.
- Candle Patterns
- Candlestick Charting Explained
- Intermarket Technical Analysis
- John Murphy on Chart Analysis
- John Murphy's Chart Pattern Recognition
- John Murphy's Market Message
- MurphyExplainsMarketAnalysis-Intermarket Analysis
- MurphyExplainsMarketAnalysis-Visual Analysis
- StockCharts.com
- Technical Analysis of the Financial Markets
- The Visual Investor
- VectorVest, Inc.
- Executive Premier Workshop
- One-Day Options Course
- OptionsPro
- Retirement Income Workshop
- Sure-Fire Trading Systems (VectorVest, Inc.)
- Trading as a Business Workshop
- VectorVest 7 EOD
- VectorVest 7 RealTime/IntraDay
- VectorVest AutoTester
- VectorVest Educational Services
- VectorVest OnLine
- VectorVest Options Analyzer
- VectorVest ProGraphics v6.0
- VectorVest ProTrader 7
- VectorVest RealTime Derby Tool
- VectorVest Simulator
- VectorVest Variator
- VectorVest Watchdog
