HOT TOPICS LIST
- MACD
- Fibonacci
- RSI
- Gann
- ADXR
- Stochastics
- Volume
- Triangles
- Futures
- Cycles
- Volatility
- ZIGZAG
- MESA
- Retracement
- Aroon
INDICATORS LIST
LIST OF TOPICS
PRINT THIS ARTICLE
by Koos van der Merwe
The tradable could start flying and soon, but it will not be unidentified. Now, where it could fly to is the real question.
Position: Buy
Koos van der Merwe
Has been a technical analyst since 1969, and has worked as a futures and options trader with First Financial Futures in Johannesburg, South Africa.
PRINT THIS ARTICLE
TRIANGLES
It's USO, Not UFO
06/11/07 03:45:43 PMby Koos van der Merwe
The tradable could start flying and soon, but it will not be unidentified. Now, where it could fly to is the real question.
Position: Buy
| The US Oil Fund (USO) is a domestic exchange traded security designed to track the movements of light, sweet crude oil (West Texas Intermediate). The investment objective of the USO is that a change in the percentage terms of the units' net asset value should reflect the changes in percentage terms of the spot price of West Texas Intermediate (WTI) light, sweet crude oil delivered to Cushing, OK, less any expenses. However, no assurance is guaranteed that the USO will meet its investment objective. So is the fund worth a buy? |

|
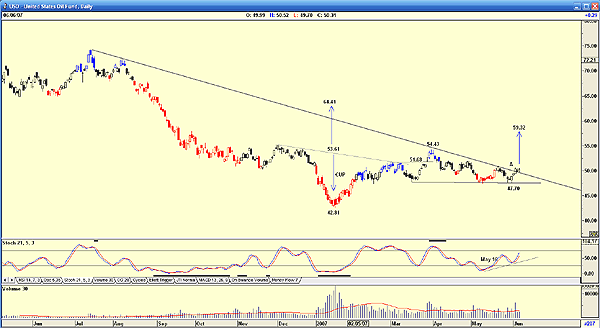
| FIGURE 1: USO, DAILY. Here's a cup & handle formation plus target, and a triangle formation with target. |
| Graphic provided by: AdvancedGET. |
| |
| Figure 1 shows how the price dropped from a high of $74.34 on July 14, 2006, to the low of $42.81 by January 17, 2007. The volume was high, but started to taper off as the price started rising, suggesting that buyers were few and uncertain. However, the price established itself at this level and volume increased, showing that more buyers were entering the market. The color of the bars turned from red to blue, suggesting a buy signal. The color changes of the price bars are an indicator of Advanced GET, with blue suggesting a buy, black suggesting neutral, and red suggesting a sell. They are there to assist in the analysts' decision making. Figure 1 also shows a cup & handle formation with a suggested target price of $64.41 (53.61 - 42.81 = 10.80 + 53.61 = 64.41). The price broke above this level and on a gap at $51.68 and rose to $54.43 before falling back into what appears to be a wedge, although with a bottom trendline that is close to a horizontal, the pattern could be regarded as a bearish triangle. However, the price bounced off the support line at $47.70 and then broke the long-term trendline at point A. Should we interpret the pattern as a wedge, the target suggested is $59.32. Note that the stochastic Indicator is trending upward after giving a buy signal on May 16 when the price was $48.68. |

|
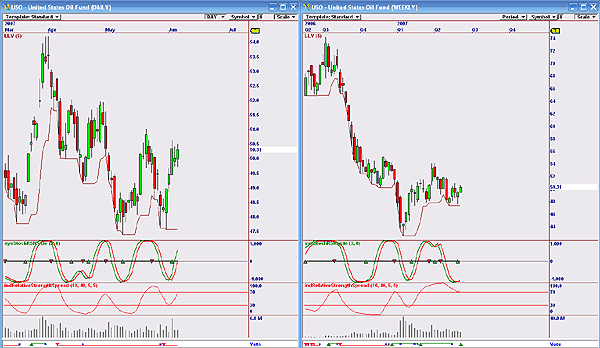
| FIGURE 2: USO, DAILY AND WEEKLY BUY/SELL SIGNALS |
| Graphic provided by: Omnitrader Professional.. |
| |
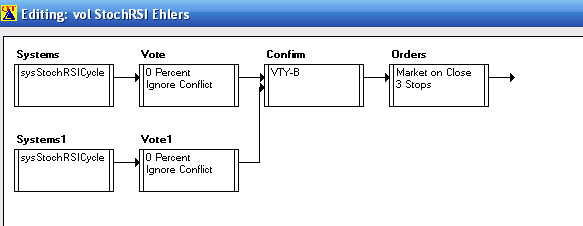
| Figure 2 is a daily and weekly OmniTrader chart. My trading strategy is a combination of four strategies: 1. A Fisher calculation of the MACD of the high 2. A stochastic RSI with the RSI parameter of 14 3. A stochastic RSI with the RSI parameter of 3 4. A stochastic RSI with the volatility of the stock included in the decision making. The strategy is shown in Figure 3. Note I have used three stop signals in the strategy. Is it a UFO I see flashing across the heavens? No, but it could be USO. |

|
| FIGURE 3: USO. Here's the strategy used to determine the OmniTrader charts. |
| Graphic provided by: Omnitrader. |
| |
| Namely, a fixed stop-loss, a trailing profit stop, and a trailing pivot stop. I have constructed a back-test period of 240 days, and a forward test period of 20 days. The results of the strategies are then combined in the final "vote" line as shown to suggest the optimal trade. Note that the daily chart, the vote line is showing a sell, while the weekly chart is showing a buy signal. The chart also shows a stochasticRSI indicator, which in both charts is suggesting a buy signal. Finally, the relative strength indicator shown is strong in both daily and weekly charts. All charts shown suggest that I should be a buyer of UFO at the bid, with a target price of at the least $59.32 with a target high of $64.41. |
Has been a technical analyst since 1969, and has worked as a futures and options trader with First Financial Futures in Johannesburg, South Africa.
| Address: | 3256 West 24th Ave |
| Vancouver, BC | |
| Phone # for sales: | 6042634214 |
| E-mail address: | petroosp@gmail.com |
Click here for more information about our publications!
PRINT THIS ARTICLE

Request Information From Our Sponsors
- VectorVest, Inc.
- Executive Premier Workshop
- One-Day Options Course
- OptionsPro
- Retirement Income Workshop
- Sure-Fire Trading Systems (VectorVest, Inc.)
- Trading as a Business Workshop
- VectorVest 7 EOD
- VectorVest 7 RealTime/IntraDay
- VectorVest AutoTester
- VectorVest Educational Services
- VectorVest OnLine
- VectorVest Options Analyzer
- VectorVest ProGraphics v6.0
- VectorVest ProTrader 7
- VectorVest RealTime Derby Tool
- VectorVest Simulator
- VectorVest Variator
- VectorVest Watchdog
- StockCharts.com, Inc.
- Candle Patterns
- Candlestick Charting Explained
- Intermarket Technical Analysis
- John Murphy on Chart Analysis
- John Murphy's Chart Pattern Recognition
- John Murphy's Market Message
- MurphyExplainsMarketAnalysis-Intermarket Analysis
- MurphyExplainsMarketAnalysis-Visual Analysis
- StockCharts.com
- Technical Analysis of the Financial Markets
- The Visual Investor
