

HOT TOPICS LIST
- MACD
- Fibonacci
- RSI
- Gann
- ADXR
- Stochastics
- Volume
- Triangles
- Futures
- Cycles
- Volatility
- ZIGZAG
- MESA
- Retracement
- Aroon
INDICATORS LIST
LIST OF TOPICS
PRINT THIS ARTICLE
by David Penn
Corrections following surge peaks in the MACD histogram are worth watching.
Position: N/A
David Penn
Technical Writer for Technical Analysis of STOCKS & COMMODITIES magazine, Working-Money.com, and Traders.com Advantage.
PRINT THIS ARTICLE
REVERSAL
A 2B Bounce In Johnson & Johnson
06/11/07 01:38:38 PMby David Penn
Corrections following surge peaks in the MACD histogram are worth watching.
Position: N/A
| While I usually don't pay a great deal of attention to individual stocks, I do keep a list of "Cramer's Anointed." These are stocks that Jim Cramer of CNBC's Mad Money flagged as being the cream of the cream of the stock crop, representing some of the best bets in corporate America. I figure that if the stock market is in good shape, then these stocks — on balance — should be breaking out, reaching new highs or, at a minimum, forging bottoms from which new rallies should emerge. |
| Johnson & Johnson (JNJ) seems to be an example of that latter category. JNJ bottomed in March 2007, along with the general market. But while the market as a whole has rallied to new highs, Johnson & Johnson has languished. After moving up from a March low near 60, JNJ reached 65 by mid-April, only to find itself below its 50-day exponential moving average (EMA) and barely above 62 in May and June. See Figure 1. |
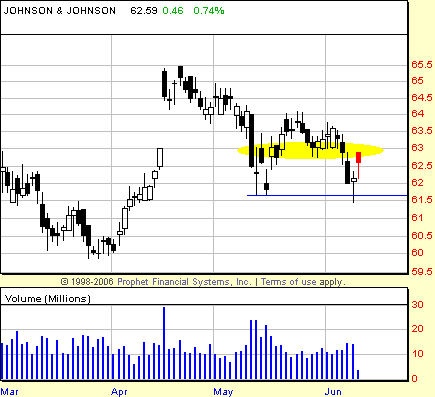
|
| FIGURE 1: JOHNSON & JOHNSON, DAILY. The failure to follow through to the downside in June after making a lower low vis-�-vis May sets up the opportunity for a bounce in shares of Johnson & Johnson. A close above 63 would be the first sign that such a move higher is likely. |
| Graphic provided by: Prophet Financial, Inc. |
| |
| Although JNJ did not find support at the 50-day EMA, it does appear that the 62 level is providing some measure of support. The low of May was 61.65 and the low of June was 61.46. There were two technical features worth noting accompanying these lows, however. The first was the fact that the lower low in price was matched by a higher low in both the moving average convergence/divergence (MACD) histogram and the stochastic. This creates a positive divergence, suggesting that the current lows in price may in fact be the low for the decline. |

|
| FIGURE 2: JOHNSON & JOHNSON, DAILY. Positive divergences in both the MACD histogram and the stochastic support the 2B bottom forming in May–June. The size of the MACD histogram peak in April suggests that any bounce will take the market above the 65 level. |
| Graphic provided by: Prophet Financial, Inc. |
| |
| The second technical feature, which supports the first, is the fact that so far, having made a lower low in June, JNJ has yet to show follow-through to the downside. Should this continue to be the case, and should JNJ close above the 63 level (which is the high of the session during which the initial higher low in May was made), then it is likely that traders will be encouraged to bet in favor of higher prices for JNJ going into the summer. See Figure 2. |
| Another point of note is the size of the MACD histogram in April. Often, when the markets are rallying from bottoms, they create a sizable MACD histogram peak, one larger than any in recent price history. This is often an excellent signal that a bottom has been made. Moreover, after a correction that may test the lows, it is also typically the case that the price high set during the MACD histogram peak will be exceeded when a successful test of bottom results in a renewed move higher. |
Technical Writer for Technical Analysis of STOCKS & COMMODITIES magazine, Working-Money.com, and Traders.com Advantage.
| Title: | Technical Writer |
| Company: | Technical Analysis, Inc. |
| Address: | 4757 California Avenue SW |
| Seattle, WA 98116 | |
| Phone # for sales: | 206 938 0570 |
| Fax: | 206 938 1307 |
| Website: | www.Traders.com |
| E-mail address: | DPenn@traders.com |
Traders' Resource Links | |
| Charting the Stock Market: The Wyckoff Method -- Books | |
| Working-Money.com -- Online Trading Services | |
| Traders.com Advantage -- Online Trading Services | |
| Technical Analysis of Stocks & Commodities -- Publications and Newsletters | |
| Working Money, at Working-Money.com -- Publications and Newsletters | |
| Traders.com Advantage -- Publications and Newsletters | |
| Professional Traders Starter Kit -- Software | |
Click here for more information about our publications!
Comments

Request Information From Our Sponsors
- VectorVest, Inc.
- Executive Premier Workshop
- One-Day Options Course
- OptionsPro
- Retirement Income Workshop
- Sure-Fire Trading Systems (VectorVest, Inc.)
- Trading as a Business Workshop
- VectorVest 7 EOD
- VectorVest 7 RealTime/IntraDay
- VectorVest AutoTester
- VectorVest Educational Services
- VectorVest OnLine
- VectorVest Options Analyzer
- VectorVest ProGraphics v6.0
- VectorVest ProTrader 7
- VectorVest RealTime Derby Tool
- VectorVest Simulator
- VectorVest Variator
- VectorVest Watchdog
- StockCharts.com, Inc.
- Candle Patterns
- Candlestick Charting Explained
- Intermarket Technical Analysis
- John Murphy on Chart Analysis
- John Murphy's Chart Pattern Recognition
- John Murphy's Market Message
- MurphyExplainsMarketAnalysis-Intermarket Analysis
- MurphyExplainsMarketAnalysis-Visual Analysis
- StockCharts.com
- Technical Analysis of the Financial Markets
- The Visual Investor