HOT TOPICS LIST
- MACD
- Fibonacci
- RSI
- Gann
- ADXR
- Stochastics
- Volume
- Triangles
- Futures
- Cycles
- Volatility
- ZIGZAG
- MESA
- Retracement
- Aroon
INDICATORS LIST
LIST OF TOPICS
PRINT THIS ARTICLE
by Chaitali Mohile
Columbia Banking System is likely to see more downside in the near future.
Position: Sell
Chaitali Mohile
Active trader in the Indian stock markets since 2003 and a full-time writer. Trading is largely based upon technical analysis.
PRINT THIS ARTICLE
DECLINING TREND
Downtrend New No More For COLB
06/26/07 03:34:50 PMby Chaitali Mohile
Columbia Banking System is likely to see more downside in the near future.
Position: Sell
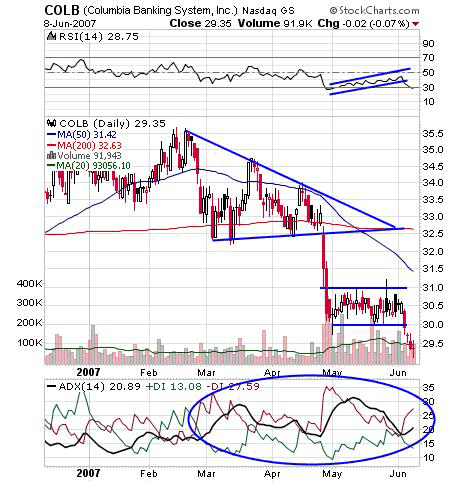
| The average directional index (ADX)14) in Figure 1 is stronger on the bear side. Increasing selling pressure had weakened the bulls since March 2007, and that captured the trend. The bearish flag consolidation made long- and short-position traders fight with equal pace, but the winning shot was by bears again with a downside breakout from above the consolidation pattern. The relative strength index (RSI)(14) made lower highs when the descending triangle was getting formed in Figure 1. The breakdown from the formation slipped the RSI to the oversold zone, recovering faster above 30. But the RSI moved in a zigzag instead moving vertically, indicating the lack of strength in an upside rally. And the breakdown from the bearish flag plunged the RSI again. |

|
| FIGURE 1: COLB, DAILY. The descending triangle and the bearish flag are in a bearish formation, and their breakout indicates more downside. |
| Graphic provided by: StockCharts.com. |
| |
| So indicators are in favor of bears. The descending triangle on the price chart in Figure 1 is another bearish formation. The downward breakout at $32.50 created fresh selling opportunities. With this declining rally from $32.50 to $30, the stock consolidates, forming a bearish flag. Both formations are in a downside continuation pattern. Meanwhile, the 50-period moving average moved below the 200-day moving average. This crossover made bears stronger, and traders can see a dipped correction on this stock. |

|
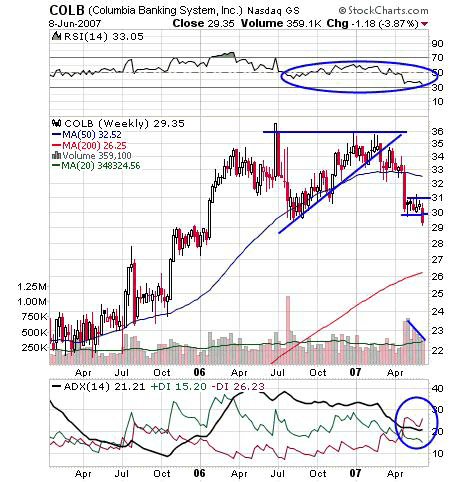
| FIGURE 2: COLB, WEEKLY. -DI crossed +DI upside indicates the downtrend is developing. |
| Graphic provided by: StockCharts.com. |
| |
| On the weekly chart (Figure 2), the ascending triangle failed to give an upside breakout. The pattern thus failed, violating the support line. Figure 2 had no weakness till the pattern failed. The wrong side breakout plunged the stock hard to $30, losing approximately 6 points from its higher level. This downside rally reduced the volume and gave birth to a bearish flag. The flag is on the edge of a breakout. Traders can enter a low-risk short position on a breakout below $30, with the target of $28 first. |
| The ADX (14) showed that new selling pressure is coming up, and buyers looked tired to carry a bullish run any further. This situation indicates a developing downtrend on the weekly chart. The negative directional index (-DI) has moved ahead of the positive directional index, confirming more selling pressure could come. The RSI (14) left its 50 support level with downside breakout of the ascending triangle and plunged below 40. The 33 level in the RSI is not traded. |
| Thus, the charts reconfirm that more downside is under way in COLB. Figure 1 was already in an intermediate downtrend, but Figure 2 is developing the downtrend, which is no more of a panic for traders. |
Active trader in the Indian stock markets since 2003 and a full-time writer. Trading is largely based upon technical analysis.
| Company: | Independent |
| Address: | C1/3 Parth Indraprasth Towers. Vastrapur |
| Ahmedabad, Guj 380015 | |
| E-mail address: | chaitalimohile@yahoo.co.in |
Traders' Resource Links | |
| Independent has not added any product or service information to TRADERS' RESOURCE. | |
Click here for more information about our publications!
PRINT THIS ARTICLE

Request Information From Our Sponsors
- StockCharts.com, Inc.
- Candle Patterns
- Candlestick Charting Explained
- Intermarket Technical Analysis
- John Murphy on Chart Analysis
- John Murphy's Chart Pattern Recognition
- John Murphy's Market Message
- MurphyExplainsMarketAnalysis-Intermarket Analysis
- MurphyExplainsMarketAnalysis-Visual Analysis
- StockCharts.com
- Technical Analysis of the Financial Markets
- The Visual Investor
- VectorVest, Inc.
- Executive Premier Workshop
- One-Day Options Course
- OptionsPro
- Retirement Income Workshop
- Sure-Fire Trading Systems (VectorVest, Inc.)
- Trading as a Business Workshop
- VectorVest 7 EOD
- VectorVest 7 RealTime/IntraDay
- VectorVest AutoTester
- VectorVest Educational Services
- VectorVest OnLine
- VectorVest Options Analyzer
- VectorVest ProGraphics v6.0
- VectorVest ProTrader 7
- VectorVest RealTime Derby Tool
- VectorVest Simulator
- VectorVest Variator
- VectorVest Watchdog
