HOT TOPICS LIST
- MACD
- Fibonacci
- RSI
- Gann
- ADXR
- Stochastics
- Volume
- Triangles
- Futures
- Cycles
- Volatility
- ZIGZAG
- MESA
- Retracement
- Aroon
INDICATORS LIST
LIST OF TOPICS
PRINT THIS ARTICLE
by Chaitali Mohile
The NYSE Composite Index completed its black crow formation. What's next?
Position: N/A
Chaitali Mohile
Active trader in the Indian stock markets since 2003 and a full-time writer. Trading is largely based upon technical analysis.
PRINT THIS ARTICLE
CANDLESTICK CHARTING
$NYA Returns On Bullish Track?
06/12/07 01:30:36 PMby Chaitali Mohile
The NYSE Composite Index completed its black crow formation. What's next?
Position: N/A
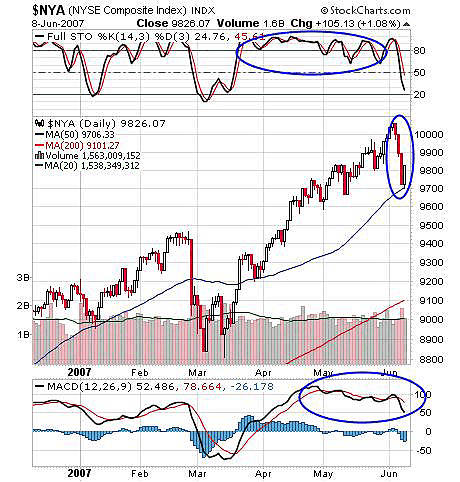
| The enormous three-day correction on US stock exchanges formed a rare formation on many of its stronger stocks and indexes. The black crow candlestick formation is bearish. Three consecutive falls with each day closes below the previous day, and each of three highs below the following day's high forms a black crow pattern on technical charts. The NYSE Composite Index has formed a similar candlestick pattern on its daily charts (Figure 1). The black crow formation is a reversal pattern toward its prior advance rally. It's a complete bearish formation by itself. The fourth day is equally important in this formation. If in Figure 1, the doji or any other bearish candles were formed on the fourth day, then traders need to stay alert as a further bearish rally is signaled. |
| Instead, $NYA formed a full bullish white candle after a black crow. What does that indicate? Regaining a bullish trend or forming a bullish counterpart of a black crow, known as three white soldiers? This white candle formed on Friday, indicating an end to the declining rally. So traders must be watchful for the next two candles too. |

|
| FIGURE 1: $NYA, DAILY. After the three black crow formation, the full white candlestick generated the possibility of the three white soldier pattern if the next candle opens within the following day's range and closes near the previous day's high. |
| Graphic provided by: StockCharts.com. |
| |
| Before the autumn, the price climbed new highs but the stochastic (14, 3, 3) slipped with a retest of its prior high, creating a negative divergence on the rally. The heavy fall in the price chart made stochastics closer to its oversold territory after a long period of three months. Meanwhile, the moving average convergence/divergence (MACD)(12, 26, 9) was reluctant to stay positive. The market gives signals, but we traders sometimes ignore such signals as they appear frequently on indicators. Yes, interest rate change news proved to be a "hurricane" on the US markets. |
| The NYSE Composite Index cannot be traded with the anticipation of three white soldiers. Traders need to watch the day's open and world market for clues about the low-risk and high-opportunity trades on the index. Stochastic (14, 3, 3) and the MACD (12, 26, 9) are still in the negative area, so be alert and watchful. |
Active trader in the Indian stock markets since 2003 and a full-time writer. Trading is largely based upon technical analysis.
| Company: | Independent |
| Address: | C1/3 Parth Indraprasth Towers. Vastrapur |
| Ahmedabad, Guj 380015 | |
| E-mail address: | chaitalimohile@yahoo.co.in |
Traders' Resource Links | |
| Independent has not added any product or service information to TRADERS' RESOURCE. | |
Click here for more information about our publications!
PRINT THIS ARTICLE

|

Request Information From Our Sponsors
- StockCharts.com, Inc.
- Candle Patterns
- Candlestick Charting Explained
- Intermarket Technical Analysis
- John Murphy on Chart Analysis
- John Murphy's Chart Pattern Recognition
- John Murphy's Market Message
- MurphyExplainsMarketAnalysis-Intermarket Analysis
- MurphyExplainsMarketAnalysis-Visual Analysis
- StockCharts.com
- Technical Analysis of the Financial Markets
- The Visual Investor
- VectorVest, Inc.
- Executive Premier Workshop
- One-Day Options Course
- OptionsPro
- Retirement Income Workshop
- Sure-Fire Trading Systems (VectorVest, Inc.)
- Trading as a Business Workshop
- VectorVest 7 EOD
- VectorVest 7 RealTime/IntraDay
- VectorVest AutoTester
- VectorVest Educational Services
- VectorVest OnLine
- VectorVest Options Analyzer
- VectorVest ProGraphics v6.0
- VectorVest ProTrader 7
- VectorVest RealTime Derby Tool
- VectorVest Simulator
- VectorVest Variator
- VectorVest Watchdog
