

HOT TOPICS LIST
- MACD
- Fibonacci
- RSI
- Gann
- ADXR
- Stochastics
- Volume
- Triangles
- Futures
- Cycles
- Volatility
- ZIGZAG
- MESA
- Retracement
- Aroon
INDICATORS LIST
LIST OF TOPICS
PRINT THIS ARTICLE
by Arthur Hill
The US Oil Fund ETF (USO) surged off support over the last few days, and the exchange traded fund is on the verge of a breakout that would signal a continuation of the prior advance.
Position: Hold
Arthur Hill
Arthur Hill is currently editor of TDTrader.com, a website specializing in trading strategies, sector/industry specific breadth stats and overall technical analysis. He passed the Society of Technical Analysts (STA London) diploma exam with distinction is a Certified Financial Technician (CFTe). Prior to TD Trader, he was the Chief Technical Analyst for Stockcharts.com and the main contributor to the ChartSchool.
PRINT THIS ARTICLE
BREAKOUTS
Oil On The Verge Of A Breakout
06/08/07 09:30:57 AMby Arthur Hill
The US Oil Fund ETF (USO) surged off support over the last few days, and the exchange traded fund is on the verge of a breakout that would signal a continuation of the prior advance.
Position: Hold
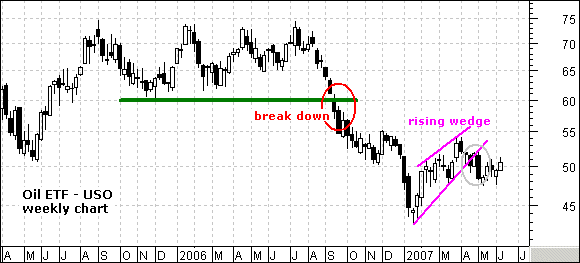
| Before moving to the potentially bullish setup, let's get some perspective with the weekly chart (Figure 1) and the current bearish pattern. The US Oil Fund ETF (USO) broke support at 60 with a sharp decline in 2006 and then rallied back above 50 in 2007. The rally formed a rising wedge and the exchange traded fund (ETF) broke a rising wedge support with a decline in early May. This break is bearish and it has yet to be proven otherwise. As long as this break remains, a test of the January lows is in order. |
|
| FIGURE 1: USO, WEEKLY. The USO broke support at 60 with a sharp decline in 2006 and then rallied back above 50 in 2007. |
| Graphic provided by: MetaStock. |
| |
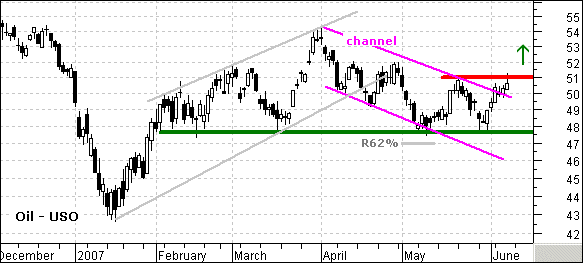
| Despite that bearish prognosis, a bullish pattern is emerging on the daily charts, and this could negate the weekly chart pattern (Figure 2). For reference, the gray trendlines show the rising wedge on the weekly chart. The ETF found support around 47.50 in May and surged to resistance at 51 over the last few days. This surge reinforces support and we must now pay heed to the falling price channel. The decline also retraced 62% of the prior advance. Both the pattern and the retracement are typical for corrections, and we should be on guard for a breakout. |
|
| FIGURE 2: USO, DAILY. A bullish pattern in emerging on the daily chart and this could negate the weekly chart pattern. |
| Graphic provided by: MetaStock. |
| |
| USO broke the upper channel trendline and is on the verge of a resistance break at 51. A close above this level would be bullish and target a move to the upper 50s. This target stems from a measured move technique. The first advance was 11 points (43 to 54) and a similar advance from the May lows would extend to around 59 (48 + 11 = 59). Should the ETF fail at resistance, look for a move below key support to trigger a bearish signal and target a move toward support around 43. |
Arthur Hill is currently editor of TDTrader.com, a website specializing in trading strategies, sector/industry specific breadth stats and overall technical analysis. He passed the Society of Technical Analysts (STA London) diploma exam with distinction is a Certified Financial Technician (CFTe). Prior to TD Trader, he was the Chief Technical Analyst for Stockcharts.com and the main contributor to the ChartSchool.
| Title: | Editor |
| Company: | TDTrader.com |
| Address: | Willem Geetsstraat 17 |
| Mechelen, B2800 | |
| Phone # for sales: | 3215345465 |
| Website: | www.tdtrader.com |
| E-mail address: | arthurh@tdtrader.com |
Traders' Resource Links | |
| TDTrader.com has not added any product or service information to TRADERS' RESOURCE. | |
Click here for more information about our publications!
PRINT THIS ARTICLE

Request Information From Our Sponsors
- StockCharts.com, Inc.
- Candle Patterns
- Candlestick Charting Explained
- Intermarket Technical Analysis
- John Murphy on Chart Analysis
- John Murphy's Chart Pattern Recognition
- John Murphy's Market Message
- MurphyExplainsMarketAnalysis-Intermarket Analysis
- MurphyExplainsMarketAnalysis-Visual Analysis
- StockCharts.com
- Technical Analysis of the Financial Markets
- The Visual Investor
- VectorVest, Inc.
- Executive Premier Workshop
- One-Day Options Course
- OptionsPro
- Retirement Income Workshop
- Sure-Fire Trading Systems (VectorVest, Inc.)
- Trading as a Business Workshop
- VectorVest 7 EOD
- VectorVest 7 RealTime/IntraDay
- VectorVest AutoTester
- VectorVest Educational Services
- VectorVest OnLine
- VectorVest Options Analyzer
- VectorVest ProGraphics v6.0
- VectorVest ProTrader 7
- VectorVest RealTime Derby Tool
- VectorVest Simulator
- VectorVest Variator
- VectorVest Watchdog