HOT TOPICS LIST
- MACD
- Fibonacci
- RSI
- Gann
- ADXR
- Stochastics
- Volume
- Triangles
- Futures
- Cycles
- Volatility
- ZIGZAG
- MESA
- Retracement
- Aroon
INDICATORS LIST
LIST OF TOPICS
PRINT THIS ARTICLE
by David Penn
The measured move in the housing index takes a hit as interest rates spike higher.
Position: N/A
David Penn
Technical Writer for Technical Analysis of STOCKS & COMMODITIES magazine, Working-Money.com, and Traders.com Advantage.
PRINT THIS ARTICLE
REVERSAL
A Reversal In Housing Stocks
06/07/07 11:55:47 AMby David Penn
The measured move in the housing index takes a hit as interest rates spike higher.
Position: N/A
| Interest rates and inventories ... that is the fundamental story of the housing market in the United States. |
| Housing stocks, as measured by the Philadelphia Housing Sector Index ($HGX), bottomed in April just as long-term interest rates, as measured by the 10-year Treasury note yield index, made a short-term peak. But the resumption of the bull market in long-term rates in mid-May led to weakness in the housing stocks just as the group was moving above its April high. |
| A month ago, I wrote that a measured move pattern in the $HGX was likely to take housing stocks higher in the near term. I projected a target of about 248 and noted that "a strong move through the 235 level" would be necessary in order to power the index past those April highs. The actual April highs were at 237. |

|
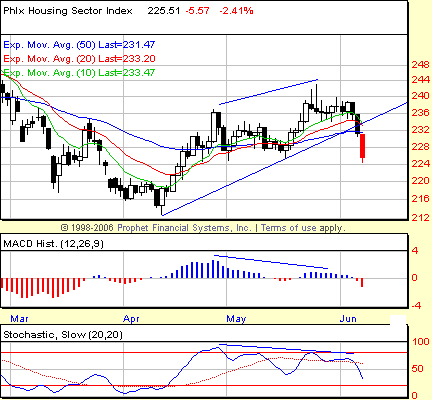
| FIGURE 1: PHILADELPHIA HOUSING SECTOR INDEX, DAILY. A breakdown below the 10-, 20-, and 50-day exponential moving averages follows a negative divergence in both the MACD histogram and the stochastic. |
| Graphic provided by: Prophet Financial, Inc. |
| |
| There was a close above 237 on May 22. However, follow-through to the upside was hard to come by. That May 22nd close was followed by two shooting star sessions — shooting stars being a candlestick pattern that warns of waning momentum. The market continued to move sideway into June. But while the market was above the April highs, both the moving average convergence/divergence (MACD) histogram and the stochastic remained below their respective April highs (Figure 1). This divergence between the higher highs in $HGX and the lower highs in both the MACD histogram and the stochastic only added to the warning that the current uptrend in $HGX was under pressure. |
| That pressure became overwhelming on June 6, as $HGX broke down not only below its uptrend line, but also below the 50-day exponential moving average. So far, this has led only to more selling, as the $HGX is now testing the May lows for support. If support is not found here and the $HGX continues to move lower, the next source of support will be the year-to-date lows made in April at the 213 level. |
Technical Writer for Technical Analysis of STOCKS & COMMODITIES magazine, Working-Money.com, and Traders.com Advantage.
| Title: | Technical Writer |
| Company: | Technical Analysis, Inc. |
| Address: | 4757 California Avenue SW |
| Seattle, WA 98116 | |
| Phone # for sales: | 206 938 0570 |
| Fax: | 206 938 1307 |
| Website: | www.Traders.com |
| E-mail address: | DPenn@traders.com |
Traders' Resource Links | |
| Charting the Stock Market: The Wyckoff Method -- Books | |
| Working-Money.com -- Online Trading Services | |
| Traders.com Advantage -- Online Trading Services | |
| Technical Analysis of Stocks & Commodities -- Publications and Newsletters | |
| Working Money, at Working-Money.com -- Publications and Newsletters | |
| Traders.com Advantage -- Publications and Newsletters | |
| Professional Traders Starter Kit -- Software | |
Click here for more information about our publications!
PRINT THIS ARTICLE

|

Request Information From Our Sponsors
- StockCharts.com, Inc.
- Candle Patterns
- Candlestick Charting Explained
- Intermarket Technical Analysis
- John Murphy on Chart Analysis
- John Murphy's Chart Pattern Recognition
- John Murphy's Market Message
- MurphyExplainsMarketAnalysis-Intermarket Analysis
- MurphyExplainsMarketAnalysis-Visual Analysis
- StockCharts.com
- Technical Analysis of the Financial Markets
- The Visual Investor
- VectorVest, Inc.
- Executive Premier Workshop
- One-Day Options Course
- OptionsPro
- Retirement Income Workshop
- Sure-Fire Trading Systems (VectorVest, Inc.)
- Trading as a Business Workshop
- VectorVest 7 EOD
- VectorVest 7 RealTime/IntraDay
- VectorVest AutoTester
- VectorVest Educational Services
- VectorVest OnLine
- VectorVest Options Analyzer
- VectorVest ProGraphics v6.0
- VectorVest ProTrader 7
- VectorVest RealTime Derby Tool
- VectorVest Simulator
- VectorVest Variator
- VectorVest Watchdog
