HOT TOPICS LIST
- MACD
- Fibonacci
- RSI
- Gann
- ADXR
- Stochastics
- Volume
- Triangles
- Futures
- Cycles
- Volatility
- ZIGZAG
- MESA
- Retracement
- Aroon
INDICATORS LIST
LIST OF TOPICS
PRINT THIS ARTICLE
by Arthur Hill
The Dow Jones Industrial Average is up substantially over the last few months, and a correction back toward its resistance breakout is a plausible scenario.
Position: Hold
Arthur Hill
Arthur Hill is currently editor of TDTrader.com, a website specializing in trading strategies, sector/industry specific breadth stats and overall technical analysis. He passed the Society of Technical Analysts (STA London) diploma exam with distinction is a Certified Financial Technician (CFTe). Prior to TD Trader, he was the Chief Technical Analyst for Stockcharts.com and the main contributor to the ChartSchool.
PRINT THIS ARTICLE
FIBONACCI
Correction Targets For The DJIA
06/08/07 09:19:54 AMby Arthur Hill
The Dow Jones Industrial Average is up substantially over the last few months, and a correction back toward its resistance breakout is a plausible scenario.
Position: Hold
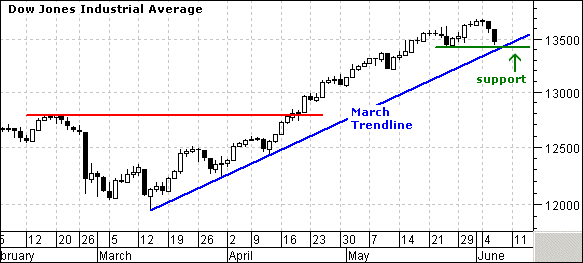
| Before looking at the correction targets for the Dow Jones Industrial Average (DJIA), let's look at the current trend and see what it would take to forge a reversal. The DJIA surged more than 1,500 points from its March low, and declines have been limited to just a few days since mid-March. The March trendline has been touched three times and marks support around 13400. The late May low also confirms this support level and a break here would start the correction process. |

|
| FIGURE 1: DJIA. Once a correction is under way, how far can we expect it to extend? |
| Graphic provided by: MetaStock. |
| |
| Once a correction gets under way, how far can we expect it to extend? Looking at Figure 1, I see two methods to identify a correction target. The first is by looking for support levels. There are no real reaction lows or consolidations from mid-March to late May, so I am relying on broken resistance. Broken resistance levels turn into support, and it is not uncommon to see a pullback to these levels. The DJIA broke resistance at 12800, and this is one target for a correction. |

|
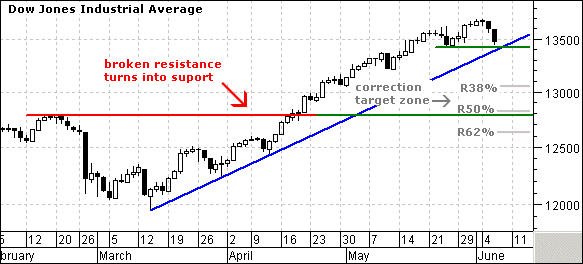
| FIGURE 2: DJIA. The Fibonacci retracement levels to watch for are 38% (0.382) and 62% (0.618). |
| Graphic provided by: MetaStock. |
| |
| The second correction target involves Fibonacci and Dow theory retracement levels. The Fibonacci retracement levels to watch are 38% (0.382) and 62% (0.618) (Figure 2). Dow theory asserts that a 50% retracement was often normal and the gray lines mark these levels. The 50% retracement jibes with broken resistance around 12800; the 62% retracement is just below and the 38% retracement is just above. There was a lot of strength in this advance, and I would opt for the higher targets by choosing a correction target zone around 12800–13000. |
Arthur Hill is currently editor of TDTrader.com, a website specializing in trading strategies, sector/industry specific breadth stats and overall technical analysis. He passed the Society of Technical Analysts (STA London) diploma exam with distinction is a Certified Financial Technician (CFTe). Prior to TD Trader, he was the Chief Technical Analyst for Stockcharts.com and the main contributor to the ChartSchool.
| Title: | Editor |
| Company: | TDTrader.com |
| Address: | Willem Geetsstraat 17 |
| Mechelen, B2800 | |
| Phone # for sales: | 3215345465 |
| Website: | www.tdtrader.com |
| E-mail address: | arthurh@tdtrader.com |
Traders' Resource Links | |
| TDTrader.com has not added any product or service information to TRADERS' RESOURCE. | |
Click here for more information about our publications!
Comments
Date: 06/14/07Rank: 1Comment:

Request Information From Our Sponsors
- StockCharts.com, Inc.
- Candle Patterns
- Candlestick Charting Explained
- Intermarket Technical Analysis
- John Murphy on Chart Analysis
- John Murphy's Chart Pattern Recognition
- John Murphy's Market Message
- MurphyExplainsMarketAnalysis-Intermarket Analysis
- MurphyExplainsMarketAnalysis-Visual Analysis
- StockCharts.com
- Technical Analysis of the Financial Markets
- The Visual Investor
- VectorVest, Inc.
- Executive Premier Workshop
- One-Day Options Course
- OptionsPro
- Retirement Income Workshop
- Sure-Fire Trading Systems (VectorVest, Inc.)
- Trading as a Business Workshop
- VectorVest 7 EOD
- VectorVest 7 RealTime/IntraDay
- VectorVest AutoTester
- VectorVest Educational Services
- VectorVest OnLine
- VectorVest Options Analyzer
- VectorVest ProGraphics v6.0
- VectorVest ProTrader 7
- VectorVest RealTime Derby Tool
- VectorVest Simulator
- VectorVest Variator
- VectorVest Watchdog
