

HOT TOPICS LIST
- MACD
- Fibonacci
- RSI
- Gann
- ADXR
- Stochastics
- Volume
- Triangles
- Futures
- Cycles
- Volatility
- ZIGZAG
- MESA
- Retracement
- Aroon
INDICATORS LIST
LIST OF TOPICS
PRINT THIS ARTICLE
by Arthur Hill
Big Lots broke out to a new high at the end of May, but a massive bearish engulfing pattern triggered a bull trap, and the forecast is for further downside.
Position: Sell
Arthur Hill
Arthur Hill is currently editor of TDTrader.com, a website specializing in trading strategies, sector/industry specific breadth stats and overall technical analysis. He passed the Society of Technical Analysts (STA London) diploma exam with distinction is a Certified Financial Technician (CFTe). Prior to TD Trader, he was the Chief Technical Analyst for Stockcharts.com and the main contributor to the ChartSchool.
PRINT THIS ARTICLE
CANDLESTICK CHARTING
A Big Bearish Engulfing For Big Lots
06/07/07 08:36:40 AMby Arthur Hill
Big Lots broke out to a new high at the end of May, but a massive bearish engulfing pattern triggered a bull trap, and the forecast is for further downside.
Position: Sell
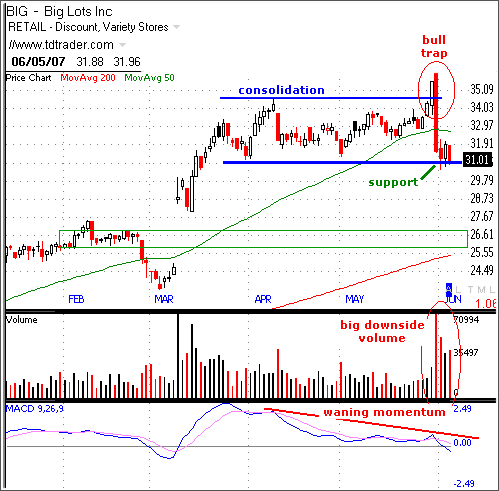
| On the price chart, Big Lots (BIG) gapped up in March and surged above 34 in early April (Figure 1). A consolidation then unfolded and the stock traded flat for around two months. The May breakout signaled an end of this consolidation and a continuation higher. However, the breakout failed miserably with the bearish engulfing and the bears now have the edge. The breakout occurred on low volume and this made it suspect. |
| The subsequent bearish engulfing occurred on huge volume and forged a classic bull trap to give the bears the edge. The bearish engulfing formed with a strong open and weak close. The red candlestick completely engulfed the prior white candlestick and broke the 50-day moving average. |
|
| FIGURE 1: BIG LOTS. BIG gapped up in March and surged above 34 in early April. |
| Graphic provided by: Telechart 2007. |
| |
| The stock firmed around its May–April lows (31), but momentum is already bearish as the moving average convergence/divergence (MACD) moved into negative territory. The indicator held in positive territory throughout the consolidation and turned up with the breakout. This signal line crossover also failed and the move into negative territory is bearish for momentum. I would take a move above the May high to turn bullish on momentum and the MACD again. |
| Even though the stock is firming at support, the high-volume decline is bearish and I expect downside follow-through. The first shoe has dropped and I am now looking for the second shoe to drop. A move below the low of the last three days would signal a continuation lower and the downside target would be around 26. This target stems from the February consolidation. In addition, the rising 200-day moving average should reach 26 in the next few weeks, and this also confirms support. |
Arthur Hill is currently editor of TDTrader.com, a website specializing in trading strategies, sector/industry specific breadth stats and overall technical analysis. He passed the Society of Technical Analysts (STA London) diploma exam with distinction is a Certified Financial Technician (CFTe). Prior to TD Trader, he was the Chief Technical Analyst for Stockcharts.com and the main contributor to the ChartSchool.
| Title: | Editor |
| Company: | TDTrader.com |
| Address: | Willem Geetsstraat 17 |
| Mechelen, B2800 | |
| Phone # for sales: | 3215345465 |
| Website: | www.tdtrader.com |
| E-mail address: | arthurh@tdtrader.com |
Traders' Resource Links | |
| TDTrader.com has not added any product or service information to TRADERS' RESOURCE. | |
Click here for more information about our publications!
Comments

Request Information From Our Sponsors
- StockCharts.com, Inc.
- Candle Patterns
- Candlestick Charting Explained
- Intermarket Technical Analysis
- John Murphy on Chart Analysis
- John Murphy's Chart Pattern Recognition
- John Murphy's Market Message
- MurphyExplainsMarketAnalysis-Intermarket Analysis
- MurphyExplainsMarketAnalysis-Visual Analysis
- StockCharts.com
- Technical Analysis of the Financial Markets
- The Visual Investor
- VectorVest, Inc.
- Executive Premier Workshop
- One-Day Options Course
- OptionsPro
- Retirement Income Workshop
- Sure-Fire Trading Systems (VectorVest, Inc.)
- Trading as a Business Workshop
- VectorVest 7 EOD
- VectorVest 7 RealTime/IntraDay
- VectorVest AutoTester
- VectorVest Educational Services
- VectorVest OnLine
- VectorVest Options Analyzer
- VectorVest ProGraphics v6.0
- VectorVest ProTrader 7
- VectorVest RealTime Derby Tool
- VectorVest Simulator
- VectorVest Variator
- VectorVest Watchdog