HOT TOPICS LIST
- MACD
- Fibonacci
- RSI
- Gann
- ADXR
- Stochastics
- Volume
- Triangles
- Futures
- Cycles
- Volatility
- ZIGZAG
- MESA
- Retracement
- Aroon
INDICATORS LIST
LIST OF TOPICS
PRINT THIS ARTICLE
by David Penn
The NASDAQ 100 drifts toward support at the level of its recent breakout.
Position: N/A
David Penn
Technical Writer for Technical Analysis of STOCKS & COMMODITIES magazine, Working-Money.com, and Traders.com Advantage.
PRINT THIS ARTICLE
BREAKOUTS
Testing The Breakout
06/05/07 02:31:26 PMby David Penn
The NASDAQ 100 drifts toward support at the level of its recent breakout.
Position: N/A
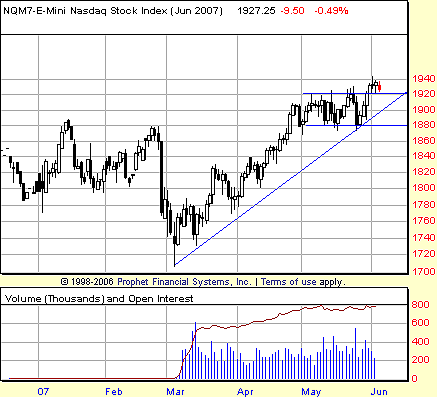
| One of the bedrock concepts of technical analysis is that price resistance, once broken through, often provides support for the ensuing pullback. So far, in the days following the NASDAQ 100's breakout above the May consolidation range, just such a pullback to resistance-turned-support appears to be taking place. See Figure 1. |
| The NASDAQ 100 bottomed in early March and then began a picture-perfect rally higher over the balance of the spring and into the summer. This rally surpassed both the February and January peaks near 1880, establishing a new year-to-date high by late April. |

|
| FIGURE 1: EMINI NASDAQ 100 STOCK INDEX, JUNE FUTURES, DAILY. The NASDAQ 100 finds itself retracing back to the 1920 level. This level provided resistance during the marketís May consolidation and now, having been surpassed, is likely to provide support for the current pullback. |
| Graphic provided by: Prophet Financial, Inc. |
| |
| Since the end of April, the NASDAQ 100 — as measured by the June emini NASDAQ 100 futures contract — has been pinned in a 40-point trading range between 1920 and 1880. While intraday prices have occasionally moved outside of this range, the NQM7 has had a difficult time closing beyond its upper and lower boundaries. |
| After testing the lower boundary (support) of the consolidation range for a third time late in May, the June emini NASDAQ 100 bounced back to the upper boundary (resistance). But this time, instead of being repelled, the NQM7 broke through, closing above 1920 and showing some mixed but nonetheless clear follow-through to the upside. |

|
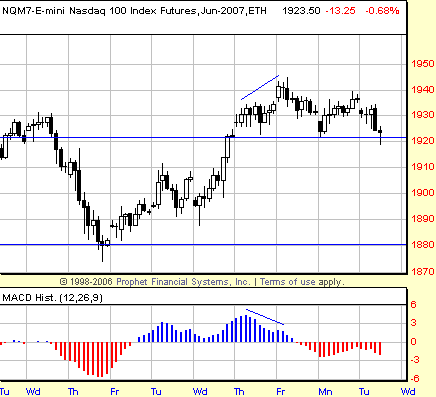
| FIGURE 2: EMINI NASDAQ 100 STOCK INDEX, JUNE FUTURES, HOURLY. A closeup of the bounce, breakout, and pullback in the emini NASDAQ shows how a negative divergence in the MACD histogram developed immediately before the pullback began. Failure to follow through to the downside below 1920 should result in a resumption of the advance that began in late May. |
| Graphic provided by: Prophet Financial, Inc. |
| |
| Figure 2 perhaps does a better job of showing the final bounce from support near 1880 and the breakthrough above 1920. In that hourly chart, we can even see the negative divergence in the moving average convergence/divergence (MACD) histogram that anticipated the pullback to the breakout level. As of this writing, that breakout level continues to act as resistance-turned-support, keeping the pullback from becoming a larger correction that would threaten the validity of the breakout. Given the size of the consolidation — roughly 40 points — traders should prepare for a move to 1960 — again assuming the resistance-turned-support level at 1920 continues to hold. |
Technical Writer for Technical Analysis of STOCKS & COMMODITIES magazine, Working-Money.com, and Traders.com Advantage.
| Title: | Technical Writer |
| Company: | Technical Analysis, Inc. |
| Address: | 4757 California Avenue SW |
| Seattle, WA 98116 | |
| Phone # for sales: | 206 938 0570 |
| Fax: | 206 938 1307 |
| Website: | www.Traders.com |
| E-mail address: | DPenn@traders.com |
Traders' Resource Links | |
| Charting the Stock Market: The Wyckoff Method -- Books | |
| Working-Money.com -- Online Trading Services | |
| Traders.com Advantage -- Online Trading Services | |
| Technical Analysis of Stocks & Commodities -- Publications and Newsletters | |
| Working Money, at Working-Money.com -- Publications and Newsletters | |
| Traders.com Advantage -- Publications and Newsletters | |
| Professional Traders Starter Kit -- Software | |
Click here for more information about our publications!
PRINT THIS ARTICLE

Request Information From Our Sponsors
- StockCharts.com, Inc.
- Candle Patterns
- Candlestick Charting Explained
- Intermarket Technical Analysis
- John Murphy on Chart Analysis
- John Murphy's Chart Pattern Recognition
- John Murphy's Market Message
- MurphyExplainsMarketAnalysis-Intermarket Analysis
- MurphyExplainsMarketAnalysis-Visual Analysis
- StockCharts.com
- Technical Analysis of the Financial Markets
- The Visual Investor
- VectorVest, Inc.
- Executive Premier Workshop
- One-Day Options Course
- OptionsPro
- Retirement Income Workshop
- Sure-Fire Trading Systems (VectorVest, Inc.)
- Trading as a Business Workshop
- VectorVest 7 EOD
- VectorVest 7 RealTime/IntraDay
- VectorVest AutoTester
- VectorVest Educational Services
- VectorVest OnLine
- VectorVest Options Analyzer
- VectorVest ProGraphics v6.0
- VectorVest ProTrader 7
- VectorVest RealTime Derby Tool
- VectorVest Simulator
- VectorVest Variator
- VectorVest Watchdog
