HOT TOPICS LIST
- MACD
- Fibonacci
- RSI
- Gann
- ADXR
- Stochastics
- Volume
- Triangles
- Futures
- Cycles
- Volatility
- ZIGZAG
- MESA
- Retracement
- Aroon
INDICATORS LIST
LIST OF TOPICS
PRINT THIS ARTICLE
by David Penn
Hourly charts of gold and gold stocks underscore the turnaround in late May.
Position: N/A
David Penn
Technical Writer for Technical Analysis of STOCKS & COMMODITIES magazine, Working-Money.com, and Traders.com Advantage.
PRINT THIS ARTICLE
REVERSAL
The Golden Bounce
06/04/07 10:35:21 AMby David Penn
Hourly charts of gold and gold stocks underscore the turnaround in late May.
Position: N/A
| My last look at gold in Traders.com Advantage ("Gold Meets Resistance," April 25, 2007) underscored the possibility that gold was not yet ready to break free from the consolidation range that ensnared it back in the summer of 2006. See Figures 1 and 2. |
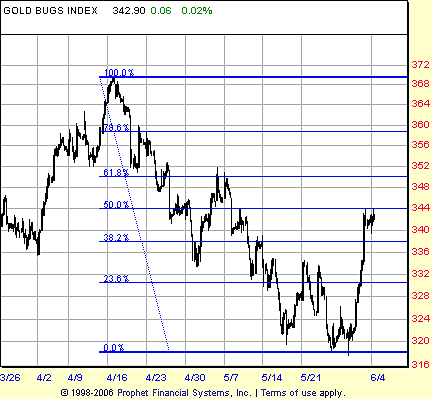
| At the time, the unhedged gold stocks represented by the $HUI were trading at about 348 (Figure 2). Over the past few months, the $HUI has fallen to as low as 318. Yet this drop only lowered the index to the middle area of its range. And there are signs in the gold market itself that this decline may already be complete. |

|
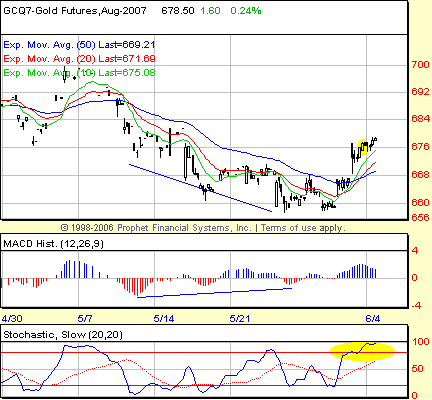
| FIGURE 1: GOLD, AUGUST FUTURES, HOURLY. Negative divergences in the MACD histogram had been building since mid-May, as this hourly chart of August gold reveals. The breakout in the stochastic (that is, the stochastic becoming overbought) followed by a bullish realignment of the 10-, 20-, and 50-period exponential moving average provide further bullish signals. |
| Graphic provided by: Prophet Financial, Inc. |
| |
| In April I looked at the gold stocks to get clues about gold. This time, I will do the opposite and focus on the bounce in gold futures, which seems to augur bullish for the stocks. Note how the troughs in the moving average convergence/divergence (MACD) histogram become more and more shallow as the decline in gold futures continued (Figure 1). This suggested waning momentum to the downside the lower the price of gold fell. The histogram was the primary technical indicator to follow in terms of looking for a potential low and a potential bounce. |

|
| FIGURE 2: GOLD BUGS INDEX ($HUI), HOURLY. The bounce in the precious metals sector has the gold BUGS index retracing fully 50% of its decline from the mid-April top. Note that the next resistance level — the 350–352 area from the countertrend bounce in late April — also matches up as a key Fibonacci retracement level. |
| Graphic provided by: Prophet Financial, Inc. |
| |
| As gold futures did indeed bounce, two other technical indicators became increasingly helpful. The first was the stochastic. By breaking out into overbought territory, the stochastic signaled that the market was in a massively bullish mode, with buyers able to close the market near its highs repeatedly in recent sessions. I like to think of a market that becomes overbought like a baseball team that just began a winning streak: Sure, that streak might end tomorrow, but betting against it is a loser's proposition over time. |
| Another bullish indication comes from the realignment of the three exponential moving averages. As I wrote in an article for Working Money.com ("Moving Average Trios," May 25, 2007), momentum traders can use crossovers of multiple moving averages to catch the sweet spot when a market is truly ready to run. The fact that moving averages are used to generate the momentum signal also makes it less likely that the surge in momentum will be a fakeout. |
Technical Writer for Technical Analysis of STOCKS & COMMODITIES magazine, Working-Money.com, and Traders.com Advantage.
| Title: | Technical Writer |
| Company: | Technical Analysis, Inc. |
| Address: | 4757 California Avenue SW |
| Seattle, WA 98116 | |
| Phone # for sales: | 206 938 0570 |
| Fax: | 206 938 1307 |
| Website: | www.Traders.com |
| E-mail address: | DPenn@traders.com |
Traders' Resource Links | |
| Charting the Stock Market: The Wyckoff Method -- Books | |
| Working-Money.com -- Online Trading Services | |
| Traders.com Advantage -- Online Trading Services | |
| Technical Analysis of Stocks & Commodities -- Publications and Newsletters | |
| Working Money, at Working-Money.com -- Publications and Newsletters | |
| Traders.com Advantage -- Publications and Newsletters | |
| Professional Traders Starter Kit -- Software | |
Click here for more information about our publications!
PRINT THIS ARTICLE

Request Information From Our Sponsors
- VectorVest, Inc.
- Executive Premier Workshop
- One-Day Options Course
- OptionsPro
- Retirement Income Workshop
- Sure-Fire Trading Systems (VectorVest, Inc.)
- Trading as a Business Workshop
- VectorVest 7 EOD
- VectorVest 7 RealTime/IntraDay
- VectorVest AutoTester
- VectorVest Educational Services
- VectorVest OnLine
- VectorVest Options Analyzer
- VectorVest ProGraphics v6.0
- VectorVest ProTrader 7
- VectorVest RealTime Derby Tool
- VectorVest Simulator
- VectorVest Variator
- VectorVest Watchdog
- StockCharts.com, Inc.
- Candle Patterns
- Candlestick Charting Explained
- Intermarket Technical Analysis
- John Murphy on Chart Analysis
- John Murphy's Chart Pattern Recognition
- John Murphy's Market Message
- MurphyExplainsMarketAnalysis-Intermarket Analysis
- MurphyExplainsMarketAnalysis-Visual Analysis
- StockCharts.com
- Technical Analysis of the Financial Markets
- The Visual Investor
