HOT TOPICS LIST
- MACD
- Fibonacci
- RSI
- Gann
- ADXR
- Stochastics
- Volume
- Triangles
- Futures
- Cycles
- Volatility
- ZIGZAG
- MESA
- Retracement
- Aroon
INDICATORS LIST
LIST OF TOPICS
PRINT THIS ARTICLE
by Jayanthi Gopalakrishnan
A bear flag formation is an indication that things could get worse, much worse.
Position: Sell
Jayanthi Gopalakrishnan
PRINT THIS ARTICLE
FLAGS AND PENNANTS
Nasdaq Bear Flag
12/15/00 02:14:30 PMby Jayanthi Gopalakrishnan
A bear flag formation is an indication that things could get worse, much worse.
Position: Sell
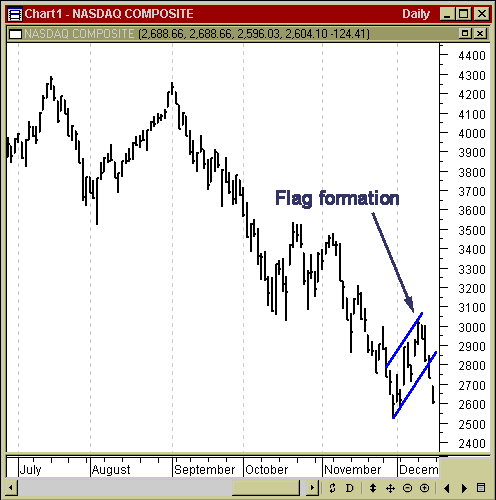
| In his book "Encyclopedia of Chart Patterns," Thomas Bulkowski states that flags only have a 12% to 13% failure rate, not a comforting thought when there is a distinct bear flag formation on the daily chart of the Nasdaq composite. |
| Flags appear in strong up- or downtrends, usually near the midpoint of the move. Flags are retracements so during a downtrend they slope upwards, and during an uptrend they slope downwards. Strictly speaking, flag formations are accompanied by declining volume but some formations occur with rising volume. Because of this I don't place an emphasis on volume. Flag formations are usually of a short duration ranging from a few days to weeks at the most. This particular flag formation lasted for 11 trading days. |

|
| The recent bear flag formation in the Nasdaq composite suggests prices could go lower. |
| Graphic provided by: MetaStock. |
| |
| The fact that flags form at the midpoint of a move is enough to cause some concern. I am inclined to start the measurement from the last retracement in early November when the Nasdaq was at approximately 3500. The lowest level at the start of the formation is about 2600. This gives us a difference of 900 points, which suggests that there is the possibility of a 900 point decline from the highest point of the formation, which is 3050. This means that the Nasdaq composite could go at least as low as 2150. |
| Title: | Editor |
| Company: | Technical Analysis of Stocks & Commodities |
| Address: | 4757 California Ave SW |
| Seattle, WA 98116 | |
| Website: | Traders.com |
| E-mail address: | Jayanthi@traders.com |
Traders' Resource Links | |
| Charting the Stock Market: The Wyckoff Method -- Books | |
| Working-Money.com -- Online Trading Services | |
| Traders.com Advantage -- Online Trading Services | |
| Technical Analysis of Stocks & Commodities -- Publications and Newsletters | |
| Working Money, at Working-Money.com -- Publications and Newsletters | |
| Traders.com Advantage -- Publications and Newsletters | |
| Professional Traders Starter Kit -- Software | |
Click here for more information about our publications!
Comments
Date: / /Rank: 5Comment:
Date: / /Rank: 5Comment: good writing
excellant topic and informative; kep up the good work !!

|

Request Information From Our Sponsors
- StockCharts.com, Inc.
- Candle Patterns
- Candlestick Charting Explained
- Intermarket Technical Analysis
- John Murphy on Chart Analysis
- John Murphy's Chart Pattern Recognition
- John Murphy's Market Message
- MurphyExplainsMarketAnalysis-Intermarket Analysis
- MurphyExplainsMarketAnalysis-Visual Analysis
- StockCharts.com
- Technical Analysis of the Financial Markets
- The Visual Investor
- VectorVest, Inc.
- Executive Premier Workshop
- One-Day Options Course
- OptionsPro
- Retirement Income Workshop
- Sure-Fire Trading Systems (VectorVest, Inc.)
- Trading as a Business Workshop
- VectorVest 7 EOD
- VectorVest 7 RealTime/IntraDay
- VectorVest AutoTester
- VectorVest Educational Services
- VectorVest OnLine
- VectorVest Options Analyzer
- VectorVest ProGraphics v6.0
- VectorVest ProTrader 7
- VectorVest RealTime Derby Tool
- VectorVest Simulator
- VectorVest Variator
- VectorVest Watchdog
