HOT TOPICS LIST
- MACD
- Fibonacci
- RSI
- Gann
- ADXR
- Stochastics
- Volume
- Triangles
- Futures
- Cycles
- Volatility
- ZIGZAG
- MESA
- Retracement
- Aroon
INDICATORS LIST
LIST OF TOPICS
PRINT THIS ARTICLE
by Chaitali Mohile
The Philadelphia Semiconductor Index is in a strong support/resistance zone.
Position: Buy
Chaitali Mohile
Active trader in the Indian stock markets since 2003 and a full-time writer. Trading is largely based upon technical analysis.
PRINT THIS ARTICLE
SUPPORT & RESISTANCE
Semiconductor Index May Get Churned
06/08/07 08:58:51 AMby Chaitali Mohile
The Philadelphia Semiconductor Index is in a strong support/resistance zone.
Position: Buy
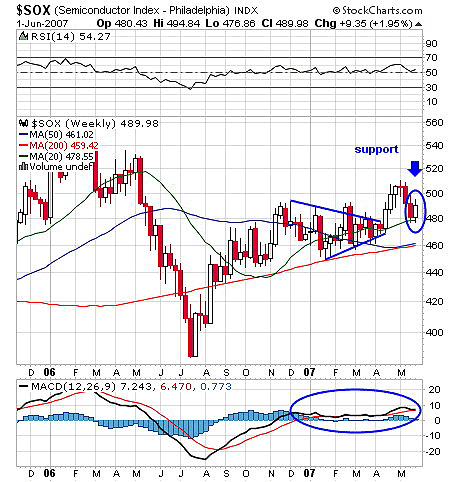
| The Philadelphia Semiconductor Index ($SOX) witnessed a huge correction from early May 2006 to mid-July 2006. On its reverse journey on the bulls side, the index had various support/resistance zones of moving averages. In this article, the support/resistance is in the context of moving averages and not trendlines. The pullback rally gained bullish strength with a 200-day moving average support but faced the resistance of a 50-day moving average. This restricted its upward journey. |
| The consolidation near the 50-day moving average sustained for about four to five months, losing upside momentum before finally forming a triangle formation. Meanwhile, the 20-day moving average also traveled to support the price breakout for the triangle. The price followed the 20-day moving average support and seems to have achieved its breakout target. Figure 1 shows that the index recently dipped to its low pivot but stood on support of the 20-day moving average. But the previous high pivot may lead to a narrow range-bound move. |

|
| FIGURE 1: $SOX, WEEKLY. Two previous weekly candles stand on support of the 20-day moving average. The prior high pivot may act as resistance to the bullish breakout. |
| Graphic provided by: StockCharts.com. |
| |
| In Figure 1, the moving average convergence/divergence (MACD) (12, 26, 9) gave a bullish crossover back in April 2006 along with a pullback rally. Since then, it has remained positive. But as the price consolidated, forming a triangle, the MACD was volatile but still positive. The relative strength index (RSI)(14) moved with its 50 level support, indicating more upside rally. Both indicators are moving close to its support line, which most likely will leave its impact on price movement as well. |

|
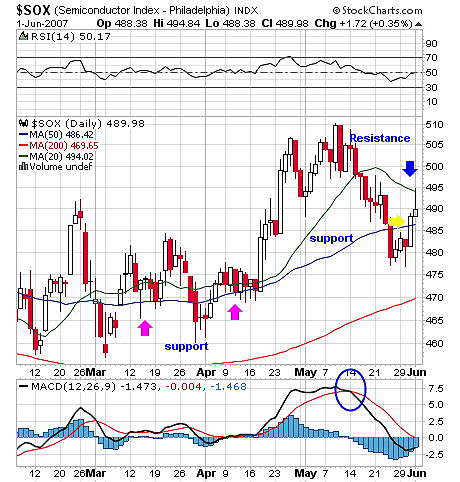
| FIGURE 2: $SOX, DAILY. The 20-day moving average is resistance and the 50-day moving average is support. The prices is thus likely to be in a much narrower range till it moves above the resistance line. |
| Graphic provided by: StockCharts.com. |
| |
| In Figure 2, $SOX is on the 50-day moving average support level and facing the resistance of the 20-day moving average at 495. The narrow range is likely to churn the further bullish path for some time. But traders need to stay alert, as the index holds stronger support than the resistance. As a result, any breakout above 500 will lead a new rally upward. Resistances are meant to be violated. In Figure 2, however, the MACD (12, 26, 9) has positioned for a bullish crossover. The RSI (14) is at 50 and ready to bounce, so buying can be expected. The buyer can look for 510 at its first target and carry on with the stop-loss of 495. |
| As the move begins with support (purple arrow), the price was unable to cross the moving average resistance, leading to consolidation till the final breakout on April 18. |
Active trader in the Indian stock markets since 2003 and a full-time writer. Trading is largely based upon technical analysis.
| Company: | Independent |
| Address: | C1/3 Parth Indraprasth Towers. Vastrapur |
| Ahmedabad, Guj 380015 | |
| E-mail address: | chaitalimohile@yahoo.co.in |
Traders' Resource Links | |
| Independent has not added any product or service information to TRADERS' RESOURCE. | |
Click here for more information about our publications!
Comments

Request Information From Our Sponsors
- StockCharts.com, Inc.
- Candle Patterns
- Candlestick Charting Explained
- Intermarket Technical Analysis
- John Murphy on Chart Analysis
- John Murphy's Chart Pattern Recognition
- John Murphy's Market Message
- MurphyExplainsMarketAnalysis-Intermarket Analysis
- MurphyExplainsMarketAnalysis-Visual Analysis
- StockCharts.com
- Technical Analysis of the Financial Markets
- The Visual Investor
- VectorVest, Inc.
- Executive Premier Workshop
- One-Day Options Course
- OptionsPro
- Retirement Income Workshop
- Sure-Fire Trading Systems (VectorVest, Inc.)
- Trading as a Business Workshop
- VectorVest 7 EOD
- VectorVest 7 RealTime/IntraDay
- VectorVest AutoTester
- VectorVest Educational Services
- VectorVest OnLine
- VectorVest Options Analyzer
- VectorVest ProGraphics v6.0
- VectorVest ProTrader 7
- VectorVest RealTime Derby Tool
- VectorVest Simulator
- VectorVest Variator
- VectorVest Watchdog
