HOT TOPICS LIST
- MACD
- Fibonacci
- RSI
- Gann
- ADXR
- Stochastics
- Volume
- Triangles
- Futures
- Cycles
- Volatility
- ZIGZAG
- MESA
- Retracement
- Aroon
INDICATORS LIST
LIST OF TOPICS
PRINT THIS ARTICLE
by Chaitali Mohile
$XAL has formed multiple bearish flag & pennant formations.
Position: Sell
Chaitali Mohile
Active trader in the Indian stock markets since 2003 and a full-time writer. Trading is largely based upon technical analysis.
PRINT THIS ARTICLE
FLAGS AND PENNANTS
Airline Index Underperforming
06/07/07 11:48:18 AMby Chaitali Mohile
$XAL has formed multiple bearish flag & pennant formations.
Position: Sell
| Bearish flag & pennants are bearish indicators in a downtrend. Certainly, the airline Index has formed more than one flag & pennant on its weekly chart (Figure 1). This formation indicates more downside in the index. The continuation pattern suggests the previous decline rally will continue with every breakout of the flag & pennant formation. |

|
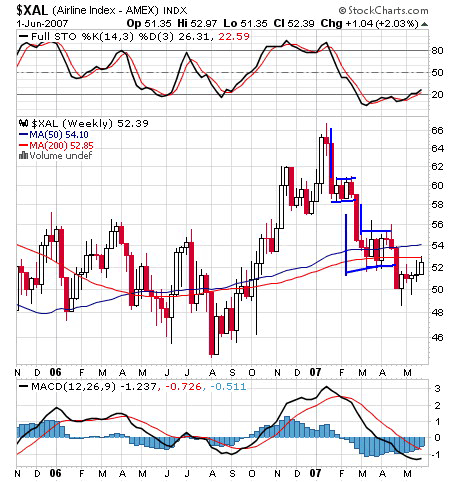
| FIGURE 1: $XAL, WEEKLY. The multiple flag & pennant formation indicates more downside. |
| Graphic provided by: StockCharts.com. |
| |
| Figure 1 shows the genuine declining rally with a high at 64. The first downward rally consolidated at 60 and its breakout gave birth to another bearish flag formation and then another, so almost three bearish flags have been formed since early January 2007. The current consolidation range is 50-52, and the flag is most likely heading for a breakout but in a bearish direction only. The range is under the resistance level of a 200-day moving average and a 50-day moving average too, even if the index tries to break out on the upside as a moving average resistance. |
| Stochastic (14, 3, 3) is at 20, which could be a buying position for new traders. But the bearish flag & pennant formation do not suggest any reliable buying opportunities. The moving average convergence/divergence (MACD)(12, 26, 9) is negative so no fresh buying is possible. |

|
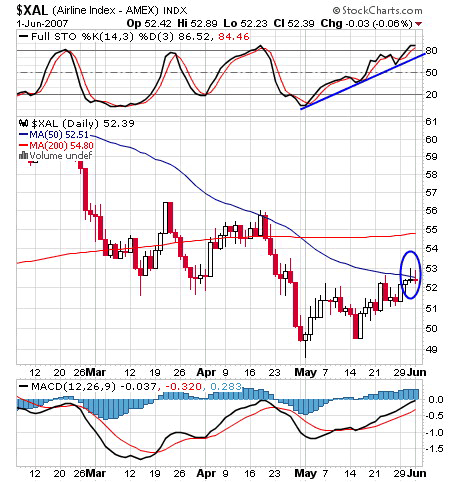
| FIGURE 2: $XAL, DAILY. The price is under moving average resistance. |
| Graphic provided by: StockCharts.com. |
| |
| The daily chart also gives a bearish signal (Figure 2). The two doji candles formed on May 31 and June 1 clearly indicate indecision, and the 50-day moving average resistance confirms more downside. Stochastic (14, 3, 3) has already reached the overbought area so hardly any upside in downtrend can be expected. The MACD (12, 26, 9) is moving higher but below its zero line. |
| Thus, looking at multiple bearish flags formed on Figure 1 and doji candles under the 50-day moving average resistance level, traders may see more downside and the airlines index will continue to underperform. A short position is possible with a breakout at 50 with prior low pivot of 48 as the first target. |
Active trader in the Indian stock markets since 2003 and a full-time writer. Trading is largely based upon technical analysis.
| Company: | Independent |
| Address: | C1/3 Parth Indraprasth Towers. Vastrapur |
| Ahmedabad, Guj 380015 | |
| E-mail address: | chaitalimohile@yahoo.co.in |
Traders' Resource Links | |
| Independent has not added any product or service information to TRADERS' RESOURCE. | |
Click here for more information about our publications!
PRINT THIS ARTICLE

Request Information From Our Sponsors
- StockCharts.com, Inc.
- Candle Patterns
- Candlestick Charting Explained
- Intermarket Technical Analysis
- John Murphy on Chart Analysis
- John Murphy's Chart Pattern Recognition
- John Murphy's Market Message
- MurphyExplainsMarketAnalysis-Intermarket Analysis
- MurphyExplainsMarketAnalysis-Visual Analysis
- StockCharts.com
- Technical Analysis of the Financial Markets
- The Visual Investor
- VectorVest, Inc.
- Executive Premier Workshop
- One-Day Options Course
- OptionsPro
- Retirement Income Workshop
- Sure-Fire Trading Systems (VectorVest, Inc.)
- Trading as a Business Workshop
- VectorVest 7 EOD
- VectorVest 7 RealTime/IntraDay
- VectorVest AutoTester
- VectorVest Educational Services
- VectorVest OnLine
- VectorVest Options Analyzer
- VectorVest ProGraphics v6.0
- VectorVest ProTrader 7
- VectorVest RealTime Derby Tool
- VectorVest Simulator
- VectorVest Variator
- VectorVest Watchdog
