HOT TOPICS LIST
- MACD
- Fibonacci
- RSI
- Gann
- ADXR
- Stochastics
- Volume
- Triangles
- Futures
- Cycles
- Volatility
- ZIGZAG
- MESA
- Retracement
- Aroon
INDICATORS LIST
LIST OF TOPICS
PRINT THIS ARTICLE
by Chaitali Mohile
Examining different charts of the same sector suggests various technical resistances.
Position: N/A
Chaitali Mohile
Active trader in the Indian stock markets since 2003 and a full-time writer. Trading is largely based upon technical analysis.
PRINT THIS ARTICLE
CHART ANALYSIS
Health Care Select Sector Awaits The Breakout
06/06/07 09:11:46 AMby Chaitali Mohile
Examining different charts of the same sector suggests various technical resistances.
Position: N/A
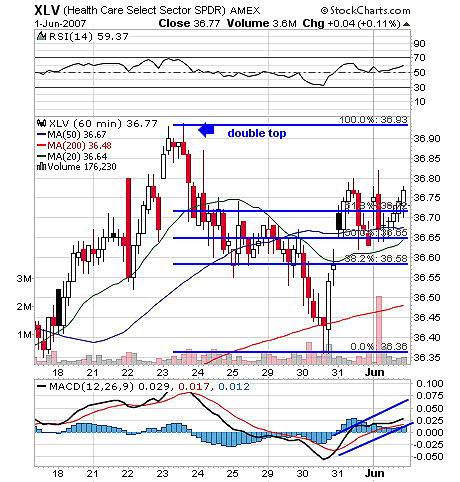
| Figure 1, an intraday chart (60-minute) of XLV, shows the double-top effect formed on May 23 and 24. The sector corrected sharply all throughout the session throughout the week, giving up all its gain on prior advance rallies. An immediate pullback on June 30 occurred on discouraging volume. The two consecutive sessions on May 31 and June 1 established support on 50% retracement level, creating an intraday high at 36.80 that is above the 61% retracement level. The stock is on edge to recover fully above 36.93, another retracement level, but as resistance this time. The relative strength index (RSI)(14) and the moving average convergence/divergence (MACD)(12, 26, 9) both indicate positive strength in a pullback rally. This creates the possibility of an upside breakout through the two major intraday resistances: a) Double top b) Retracement level. |

|
| FIGURE 1: XLV, 60-MINUTE. The double top and highest retracement level is the next resistance for intraday rally. |
| Graphic provided by: StockCharts.com. |
| |
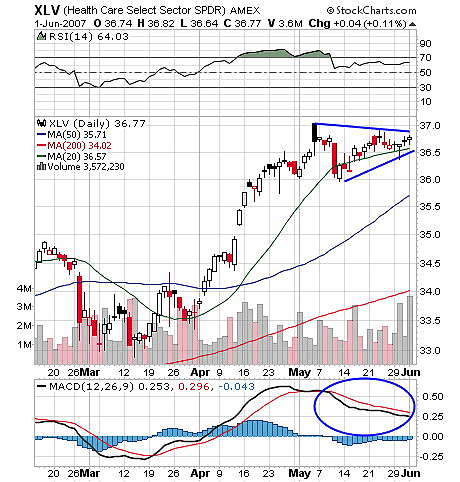
| In Figure 2, which shows the daily time frame, we see that a symmetrical triangle has been formed. Various small candles shows an exhausted rally. In the form of a symmetrical triangle, the direction of the breakout is difficult to judge. Whether the upper trendline resistance is crossed or the lower support trendline is violated is difficult to determine ahead of time. |

|
| FIGURE 2: XLV, DAILY. The upper trendline of a triangle is the resistance for a bullish move. A small doji within the triangle suggests indecision about the breakout direction. |
| Graphic provided by: StockCharts.com. |
| |
| Again in Figure 2, the two indicator positions are quite different from that in Figure 1. The daily chart shows the RSI at 64, indicating a bullish rally ahead. But the MACD (12, 26, 0) is still in the negative zone, even if the MACD histogram continued below its zero line. Such conditions create trading confusion, and traders can only wait for actual breakout. With a symmetrical triangle I would avoid giving any targets for trading. The usual way to measure a minimum level is by calculating the length of the triangle. So on a directional breakout, the triangle length can be considered. |

|
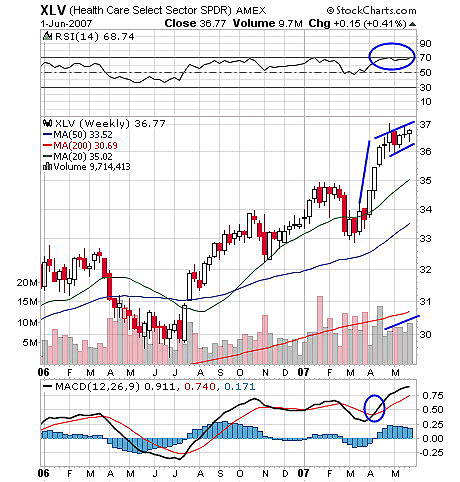
| FIGURE 3: XLV, WEEKLY. The flag & pennant breakout direction is up. An actual low-risk trade is possible only with a confirmed breakout. |
| Graphic provided by: StockCharts.com. |
| |
| The advance rally that geared up with the support of 20-period moving average consolidated ahead, forming a flag & pennant. This formation is a continuation pattern of a previous rally — precisely, a bullish rally in Figure 3, which gives more of a positive outlook than Figures 1 and 2. The RSI (14) is marginally overbought, and the MACD (12, 26, 9) with bullish crossover in April remained positive thereafter. This encourages me to calculate the new level on the breakout of the flag & pennant formation. The length of the advance rally (34–36) is two points. The consolidation range is 36–37, so when you add 2 to the possible breakout level at 37, the new level is 39. This target should be considered only with a confirmed breakout. |
| Thus, three different charts show different formations but leave us undecided about a breakout. Only Figure 3, the weekly chart, indicates some positive view for the breakout, which is the most awaited. If the retracement resistance in Figure 1, the symmetrical triangle in Figure 2, and the bullish flag & pennant in Figure 3, gives an upside breakout, a fresh bull run is expected, but until then, traders are left in a no-trading zone. |
Active trader in the Indian stock markets since 2003 and a full-time writer. Trading is largely based upon technical analysis.
| Company: | Independent |
| Address: | C1/3 Parth Indraprasth Towers. Vastrapur |
| Ahmedabad, Guj 380015 | |
| E-mail address: | chaitalimohile@yahoo.co.in |
Traders' Resource Links | |
| Independent has not added any product or service information to TRADERS' RESOURCE. | |
Click here for more information about our publications!
PRINT THIS ARTICLE

Request Information From Our Sponsors
- StockCharts.com, Inc.
- Candle Patterns
- Candlestick Charting Explained
- Intermarket Technical Analysis
- John Murphy on Chart Analysis
- John Murphy's Chart Pattern Recognition
- John Murphy's Market Message
- MurphyExplainsMarketAnalysis-Intermarket Analysis
- MurphyExplainsMarketAnalysis-Visual Analysis
- StockCharts.com
- Technical Analysis of the Financial Markets
- The Visual Investor
- VectorVest, Inc.
- Executive Premier Workshop
- One-Day Options Course
- OptionsPro
- Retirement Income Workshop
- Sure-Fire Trading Systems (VectorVest, Inc.)
- Trading as a Business Workshop
- VectorVest 7 EOD
- VectorVest 7 RealTime/IntraDay
- VectorVest AutoTester
- VectorVest Educational Services
- VectorVest OnLine
- VectorVest Options Analyzer
- VectorVest ProGraphics v6.0
- VectorVest ProTrader 7
- VectorVest RealTime Derby Tool
- VectorVest Simulator
- VectorVest Variator
- VectorVest Watchdog
