HOT TOPICS LIST
- MACD
- Fibonacci
- RSI
- Gann
- ADXR
- Stochastics
- Volume
- Triangles
- Futures
- Cycles
- Volatility
- ZIGZAG
- MESA
- Retracement
- Aroon
INDICATORS LIST
LIST OF TOPICS
PRINT THIS ARTICLE
by Koos van der Merwe
Is the current chart of the advance-decline line of the Dow Jones Industrial Average trying to tell us something?
Position: Hold
Koos van der Merwe
Has been a technical analyst since 1969, and has worked as a futures and options trader with First Financial Futures in Johannesburg, South Africa.
PRINT THIS ARTICLE
A/D LINE
The Advance-Decline Line
06/01/07 09:02:01 AMby Koos van der Merwe
Is the current chart of the advance-decline line of the Dow Jones Industrial Average trying to tell us something?
Position: Hold
| The advance and decline line is a cumulative, ongoing sum of the difference between the number of stocks closing higher minus the number of stocks closing lower each day. It can be used as a measure of market strength as it moves higher when there are more advancing issues than declining issues. |

|
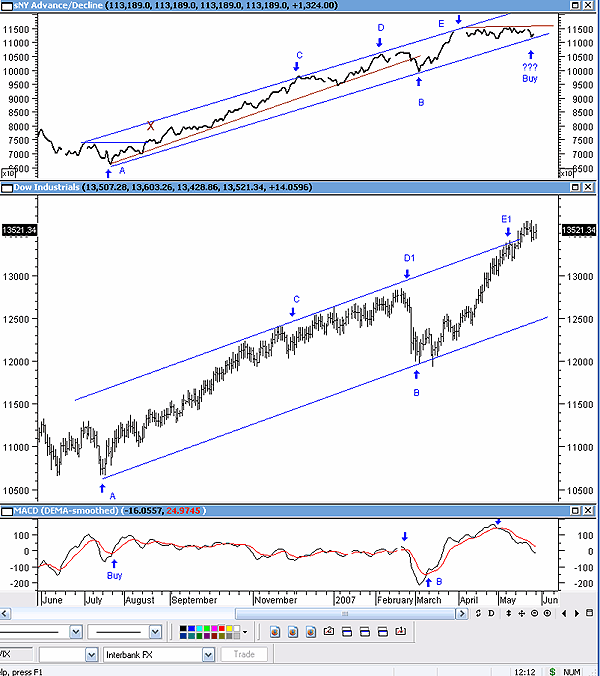
| FIGURE 1: DOW JONES INDUSTRIAL AVERAGE. Is a possible buy signal in the works for the DJIA? |
| Graphic provided by: MetaStock. |
| |
| Figure 1 shows the advance-decline line of the Dow Jones Industrial Average (DJIA). The start of the recent bull run from point A can only be seen in hindsight. We could argue that the move above a previous high at point X could be the target buy signal, but the moving average convergence/divergence (MACD) buy signal shown would have been far more convincing. The A/D line could therefore be more supportive of a signal given by other indicators. For example, a trendline parallel to the CD trendline and drawn through point A would have supported the buy signal on the DJIA chart at point B, a signal given by the MACD. |
| The real advantage of the A/D line is the forecast of a possible future reversal. This can be seen where the A/D line started moving sideways from point E, while the DJIA was still advancing strongly. Price strength on falling volume is a sign of weakness, and the number of shares traded could in a way be considered volume. The sell signal anticipated was eventually given by the MACD at E1, with the DJIA making new highs while the MACD started falling and the A/D line still moving sideways. At the moment, the A/D line is testing its support line, suggesting a possible buy signal for the DJIA. This must still be verified by the MACD. This would be more optimistic than the "Sell in May and go away" scenario, however, and we would start looking for stocks that could be ones you would like to own once a more definite buy signal is given with your indicator of choice. |
Has been a technical analyst since 1969, and has worked as a futures and options trader with First Financial Futures in Johannesburg, South Africa.
| Address: | 3256 West 24th Ave |
| Vancouver, BC | |
| Phone # for sales: | 6042634214 |
| E-mail address: | petroosp@gmail.com |
Click here for more information about our publications!
Comments

Request Information From Our Sponsors
- VectorVest, Inc.
- Executive Premier Workshop
- One-Day Options Course
- OptionsPro
- Retirement Income Workshop
- Sure-Fire Trading Systems (VectorVest, Inc.)
- Trading as a Business Workshop
- VectorVest 7 EOD
- VectorVest 7 RealTime/IntraDay
- VectorVest AutoTester
- VectorVest Educational Services
- VectorVest OnLine
- VectorVest Options Analyzer
- VectorVest ProGraphics v6.0
- VectorVest ProTrader 7
- VectorVest RealTime Derby Tool
- VectorVest Simulator
- VectorVest Variator
- VectorVest Watchdog
- StockCharts.com, Inc.
- Candle Patterns
- Candlestick Charting Explained
- Intermarket Technical Analysis
- John Murphy on Chart Analysis
- John Murphy's Chart Pattern Recognition
- John Murphy's Market Message
- MurphyExplainsMarketAnalysis-Intermarket Analysis
- MurphyExplainsMarketAnalysis-Visual Analysis
- StockCharts.com
- Technical Analysis of the Financial Markets
- The Visual Investor
