HOT TOPICS LIST
- MACD
- Fibonacci
- RSI
- Gann
- ADXR
- Stochastics
- Volume
- Triangles
- Futures
- Cycles
- Volatility
- ZIGZAG
- MESA
- Retracement
- Aroon
INDICATORS LIST
LIST OF TOPICS
PRINT THIS ARTICLE
by David Penn
An early test of the rally in rates looms on the horizon.
Position: N/A
David Penn
Technical Writer for Technical Analysis of STOCKS & COMMODITIES magazine, Working-Money.com, and Traders.com Advantage.
PRINT THIS ARTICLE
TECHNICAL ANALYSIS
Smells Like Reflation
06/01/07 10:18:07 AMby David Penn
An early test of the rally in rates looms on the horizon.
Position: N/A
| Interest rates on the 10-year Treasury note bottomed in the spring of 2005 near the 3.9% level. From the spring of 2005 until the spring of 2006, T-note rates advanced strongly, climbing to just over 5.2% by the end of June. Following the June peak, the yield corrected a full, Fibonacci 61.8% to the 4.4% level late in 2006. This late 2006 low was accompanied by positive divergences in both the moving average convergence/divergence (MACD) histogram and the stochastic, making it particularly likely that a significant bottom was formed at that time. |
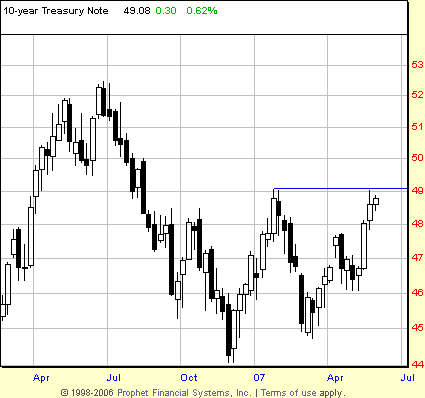
| Since that bottom, rates on the 10-year ($TNX) have been moving higher, rallying to 4.9% early in the first quarter of 2007 before correcting and creating a higher low vis-a-vis the fourth-quarter 2006 low. There is really only one definition of an uptrend that traders need to keep in mind: higher highs and higher lows. So far, with the lows in late 2006 and early 2007, the $TNX has fulfilled the second half of that bargain. Over the next few weeks, we will learn whether $TNX can fulfill the first. See Figure 1. |

|
| FIGURE 1: 10-YEAR TREASURY NOTE YIELD ($TNX), WEEKLY. A pattern of higher lows has just begun in this weekly chart of the yield on the 10-year T-note. Surpassing the high from the first quarter of 2007 will allow for a key higher high as well, and the clear establishment of an uptrend in $TNX. |
| Graphic provided by: Prophet Financial, Inc. |
| |
| The high from the first quarter of 2007 is about 4.96% — or 4.879% on a weekly closing basis. So far in the second quarter, the $TNX has come extremely close to besting that level but has failed to do so. Should $TNX be unable to take out the first-quarter 2007 high — or if the $TNX surpassed that high but failed to follow through and instead reversed and began moving lower — then the first-quarter 2007 lows near 4.5% would be the most immediate downside target. If the $TNX does take out the first-quarter 2007 high, however, there is precious little between the first-quarter 2007 high and the highs of 2006. |

|
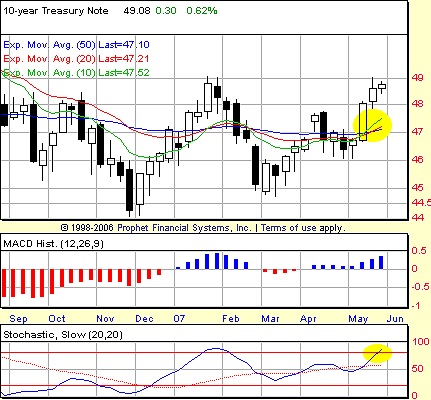
| FIGURE 2: 10-YEAR TREASURY NOTE YIELD ($TNX), WEEKLY. Potential buy signals in the BOSO stochastic and the moving average trios could join the confirmed buy signal from the MACD histogram in signaling higher long-term interest rates in the near future. |
| Graphic provided by: Prophet Financial, Inc. |
| |
| With regard to specific technical trading notes, a number of bullish signals have developed or are in the process of developing in the $TNX. The first bullish signal since the positive divergence (a bid in December 2006) has come from the MACD histogram, which formed a bullish M-m-M pattern in the middle of May 2007. That pattern was confirmed as of the end of the third week of the month. The other two bullish signals are still in the making. The second technical I consider is the BOSO stochastic (see my article "BOSO" from the October 5, 2005, issue of Working-Money.com), which just entered overbought territory and is awaiting confirmation by way of follow-through to the upside. See Figure 2. |
| Third, is the potential for a bullish realignment in the 10-, 20-, and 50-period exponential moving averages (EMAs). These realignments can be powerful events, especially on the weekly chart. Consider, for example, that the last bullish realignment in the $TNX in October 2005 got traders long with yields near 4.56%. The $TNX rallied to the June 2006 high north of 5.2% before that alignment was lost in August 2006 with the $TNX near 4.7%. Right now, the $TNX has created a bullish realignment as of the week ended May 25. Should the $TNX close above the high of this week, then a buy signal based on the bullish realignment of the moving averages would also be in place. |
Technical Writer for Technical Analysis of STOCKS & COMMODITIES magazine, Working-Money.com, and Traders.com Advantage.
| Title: | Technical Writer |
| Company: | Technical Analysis, Inc. |
| Address: | 4757 California Avenue SW |
| Seattle, WA 98116 | |
| Phone # for sales: | 206 938 0570 |
| Fax: | 206 938 1307 |
| Website: | www.Traders.com |
| E-mail address: | DPenn@traders.com |
Traders' Resource Links | |
| Charting the Stock Market: The Wyckoff Method -- Books | |
| Working-Money.com -- Online Trading Services | |
| Traders.com Advantage -- Online Trading Services | |
| Technical Analysis of Stocks & Commodities -- Publications and Newsletters | |
| Working Money, at Working-Money.com -- Publications and Newsletters | |
| Traders.com Advantage -- Publications and Newsletters | |
| Professional Traders Starter Kit -- Software | |
Click here for more information about our publications!
PRINT THIS ARTICLE

Request Information From Our Sponsors
- StockCharts.com, Inc.
- Candle Patterns
- Candlestick Charting Explained
- Intermarket Technical Analysis
- John Murphy on Chart Analysis
- John Murphy's Chart Pattern Recognition
- John Murphy's Market Message
- MurphyExplainsMarketAnalysis-Intermarket Analysis
- MurphyExplainsMarketAnalysis-Visual Analysis
- StockCharts.com
- Technical Analysis of the Financial Markets
- The Visual Investor
- VectorVest, Inc.
- Executive Premier Workshop
- One-Day Options Course
- OptionsPro
- Retirement Income Workshop
- Sure-Fire Trading Systems (VectorVest, Inc.)
- Trading as a Business Workshop
- VectorVest 7 EOD
- VectorVest 7 RealTime/IntraDay
- VectorVest AutoTester
- VectorVest Educational Services
- VectorVest OnLine
- VectorVest Options Analyzer
- VectorVest ProGraphics v6.0
- VectorVest ProTrader 7
- VectorVest RealTime Derby Tool
- VectorVest Simulator
- VectorVest Variator
- VectorVest Watchdog
