HOT TOPICS LIST
- MACD
- Fibonacci
- RSI
- Gann
- ADXR
- Stochastics
- Volume
- Triangles
- Futures
- Cycles
- Volatility
- ZIGZAG
- MESA
- Retracement
- Aroon
INDICATORS LIST
LIST OF TOPICS
PRINT THIS ARTICLE
by Arthur Hill
Cymer has been underperforming the market for months, and the stock is on the verge of a support break that would signal a continuation lower.
Position: Sell
Arthur Hill
Arthur Hill is currently editor of TDTrader.com, a website specializing in trading strategies, sector/industry specific breadth stats and overall technical analysis. He passed the Society of Technical Analysts (STA London) diploma exam with distinction is a Certified Financial Technician (CFTe). Prior to TD Trader, he was the Chief Technical Analyst for Stockcharts.com and the main contributor to the ChartSchool.
PRINT THIS ARTICLE
REL. STR COMPARATIVE
Relative Weakness Weighs On Cymer
06/01/07 08:46:38 AMby Arthur Hill
Cymer has been underperforming the market for months, and the stock is on the verge of a support break that would signal a continuation lower.
Position: Sell
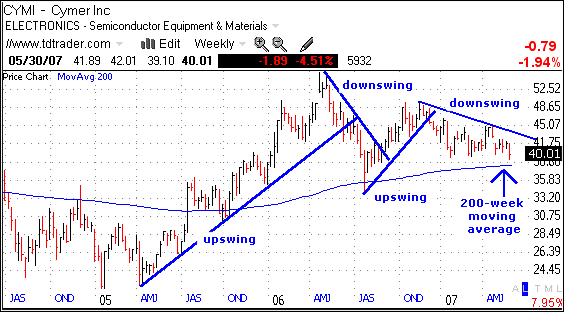
| Let's start out with the weekly chart for some perspective (Figure 1). There are four distinct swings. For the first swing, the stock more than doubled from April 2005 to April 2006. In the process, CYMI broke the 200-week moving average and exceeded 50. On the second swing, the stock returned to this moving average with a sharp decline below 35 (gray oval). |

|
| FIGURE 1: CYMI, WEEKLY. The four distinct swings in this chart suggests there may be coming weakness in this stock. |
| Graphic provided by: Telechart 2007. |
| |
| The third swing marked a retracement of the second swing and the stock met resistance around 49. The fourth and current swing is down, and the stock is once again poised for a test of the 200-week moving average. A break below this level would argue for weakness toward the next support level around 30. |
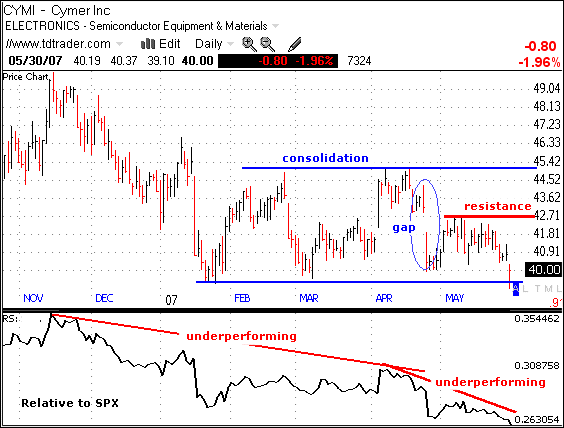
| On the daily chart (Figure 2), CYMI declined to around 39–40 in January and then began a five-month trading range. The stock has been bound by 39 and 46 since January 20, and this range holds the next key. A break above the range highs would be bullish and a break below the range lows would be bearish. Given the prior decline and late April gap, the odds favor a downside break. The four- to five-month pattern looks like a large rectangle, and a break below 39 would target further weakness toward 33. The length of the pattern was subtracted from the break point for a target. |

|
| FIGURE 2: CYMI, DAILY. This stock declined to around 39&ndash&40 in January and then began a five-month trading range. |
| Graphic provided by: Telechart 2007. |
| |
| Relative weakness also favors a downside break. The line chart at the bottom shows the price relative (CYMI divided by the Standard & Poor's 500). The line rises when CYMI outperforms and falls when CYMI underperforms. CYMI has clearly been underperforming the S&P 500 since November. The price relative broke to new lows in late April and again in May. The stock is a clear laggard on the upside and leader on the downside. This favors a support break and further weakness. |
Arthur Hill is currently editor of TDTrader.com, a website specializing in trading strategies, sector/industry specific breadth stats and overall technical analysis. He passed the Society of Technical Analysts (STA London) diploma exam with distinction is a Certified Financial Technician (CFTe). Prior to TD Trader, he was the Chief Technical Analyst for Stockcharts.com and the main contributor to the ChartSchool.
| Title: | Editor |
| Company: | TDTrader.com |
| Address: | Willem Geetsstraat 17 |
| Mechelen, B2800 | |
| Phone # for sales: | 3215345465 |
| Website: | www.tdtrader.com |
| E-mail address: | arthurh@tdtrader.com |
Traders' Resource Links | |
| TDTrader.com has not added any product or service information to TRADERS' RESOURCE. | |
Click here for more information about our publications!
PRINT THIS ARTICLE

Request Information From Our Sponsors
- StockCharts.com, Inc.
- Candle Patterns
- Candlestick Charting Explained
- Intermarket Technical Analysis
- John Murphy on Chart Analysis
- John Murphy's Chart Pattern Recognition
- John Murphy's Market Message
- MurphyExplainsMarketAnalysis-Intermarket Analysis
- MurphyExplainsMarketAnalysis-Visual Analysis
- StockCharts.com
- Technical Analysis of the Financial Markets
- The Visual Investor
- VectorVest, Inc.
- Executive Premier Workshop
- One-Day Options Course
- OptionsPro
- Retirement Income Workshop
- Sure-Fire Trading Systems (VectorVest, Inc.)
- Trading as a Business Workshop
- VectorVest 7 EOD
- VectorVest 7 RealTime/IntraDay
- VectorVest AutoTester
- VectorVest Educational Services
- VectorVest OnLine
- VectorVest Options Analyzer
- VectorVest ProGraphics v6.0
- VectorVest ProTrader 7
- VectorVest RealTime Derby Tool
- VectorVest Simulator
- VectorVest Variator
- VectorVest Watchdog
