HOT TOPICS LIST
- MACD
- Fibonacci
- RSI
- Gann
- ADXR
- Stochastics
- Volume
- Triangles
- Futures
- Cycles
- Volatility
- ZIGZAG
- MESA
- Retracement
- Aroon
INDICATORS LIST
LIST OF TOPICS
PRINT THIS ARTICLE
by David Penn
Positive divergences, bullish moving average alignments, and overbought conditions combine to make the greenback attractive.
Position: N/A
David Penn
Technical Writer for Technical Analysis of STOCKS & COMMODITIES magazine, Working-Money.com, and Traders.com Advantage.
PRINT THIS ARTICLE
REVERSAL
Should You Buy The Dollar?
05/31/07 10:42:55 AMby David Penn
Positive divergences, bullish moving average alignments, and overbought conditions combine to make the greenback attractive.
Position: N/A
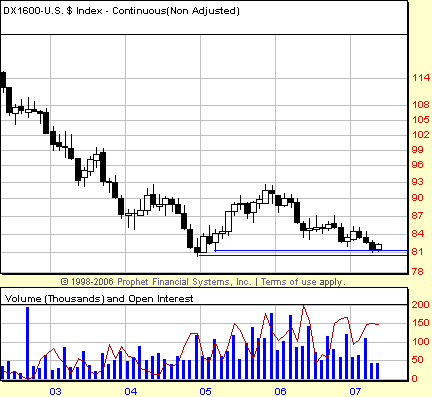
| Full disclosure: You'll find no one who has been more intermittently bullish on the dollar than I have been. While I've spent time chronicling and anticipating dollar moves in both directions for years, I've always maintained an underlying suspicion that the dollar would sooner or later catch those who were betting heavily against it by surprise. After all, most of the biggest financial calamities have come as a result of traders and speculators becoming complacent with "can't-lose" bets such as the relationship between short- and long-term oil prices in the early 1990s or Russian debt spreads in the late 1990s. As such, the collapse in the US dollar, widely taken for granted, has been on my contrarian radar for a long time. See Figure 1. |
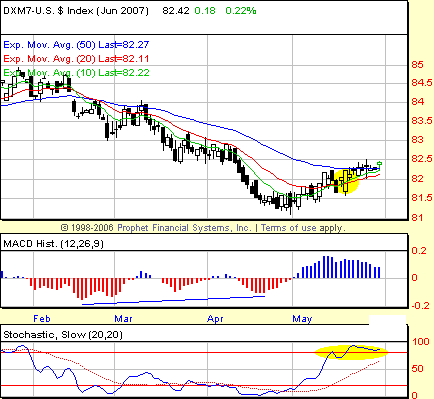
| We are again seeing signs of a move higher in the dollar. First, the evidence of a significant low comes from the positive divergence in the moving average convergence/divergence (MACD) histogram (Figure 2). This divergence is between the lows of mid-February and the lows of mid-April. In addition, the size of the MACD histogram as the dollar (basis June) bounce in May was the largest it had been since the greenback topped out in early January -- another bullish sign. |

|
| FIGURE 1: US DOLLAR INDEX, CONTINUOUS FUTURES, MONTHLY. The most recent decline in the dollar, which began in late 2005, finds the market testing multiyear lows in the summer of 2007. |
| Graphic provided by: Prophet Financial, Inc. |
| |
| The June dollar has also become overbought. Contrary to conventional wisdom, overbought markets can often be successfully and profitably traded to the long side (see my Working Money.com article "BOSO" from October 5, 2005). After all, an overbought stochastic simply means the buyers are on a win streak, forcing the market to close at the upper end of its range session after session after session. While this will not last forever, fading a streak (as any gambler will tell you) can be an expensive proposition. |

|
| FIGURE 2: US DOLLAR INDEX, JUNE FUTURES, DAILY. All that remains from a complete, “all clear” to the upside in the June dollar is a bullish realignment of the moving averages that puts the shortest moving average on top of both the intermediate- and longer-term moving averages. |
| Graphic provided by: Prophet Financial, Inc. |
| |
| Since first becoming overbought on May 14, the June dollar reentered overbought territory on the 18th. It is important to note there have been follow-through closes above the high of the overbought sessions on the 14th and 18th. This provides confirmation for the overbought trade (a BOSO long), a position that generally can be held until the reverse happens -- the market slips from being overbought and shows follow-through with lower closes. The last factor has yet to fully develop -- and may not. However, given the positive divergences, the new MACD histogram peak, and the overbought reading in the stochastic, it is likely that this last factor -- a bullish realignment of the short-, intermediate-, and longer-term moving averages -- will also manifest itself. Right now, the shortest exponential moving average, the 10-day, has crossed above the 20-day. But both of those moving averages remain below the 50-day EMA. A bullish realignment will occur as soon as both the 10-day and 20-day are above the 50-day, with the 10-day remaining above the 20-day. |
| The June greenback is advancing toward a source of potential resistance near 82.5. This resistance lingers from the lows of the second half of March. Given that the June greenback has moved almost without correction from its low near 81.25 to almost 82.5, a pullback as resistance is enjoined would not be surprising in the least. If that pullback occurs, however, keep an eye on the stochastic. As long as the stochastic does not lose its overbought status and confirm that with lower closing lows, the advance in the June greenback will remain intact. |
Technical Writer for Technical Analysis of STOCKS & COMMODITIES magazine, Working-Money.com, and Traders.com Advantage.
| Title: | Technical Writer |
| Company: | Technical Analysis, Inc. |
| Address: | 4757 California Avenue SW |
| Seattle, WA 98116 | |
| Phone # for sales: | 206 938 0570 |
| Fax: | 206 938 1307 |
| Website: | www.Traders.com |
| E-mail address: | DPenn@traders.com |
Traders' Resource Links | |
| Charting the Stock Market: The Wyckoff Method -- Books | |
| Working-Money.com -- Online Trading Services | |
| Traders.com Advantage -- Online Trading Services | |
| Technical Analysis of Stocks & Commodities -- Publications and Newsletters | |
| Working Money, at Working-Money.com -- Publications and Newsletters | |
| Traders.com Advantage -- Publications and Newsletters | |
| Professional Traders Starter Kit -- Software | |
Click here for more information about our publications!
PRINT THIS ARTICLE

Request Information From Our Sponsors
- StockCharts.com, Inc.
- Candle Patterns
- Candlestick Charting Explained
- Intermarket Technical Analysis
- John Murphy on Chart Analysis
- John Murphy's Chart Pattern Recognition
- John Murphy's Market Message
- MurphyExplainsMarketAnalysis-Intermarket Analysis
- MurphyExplainsMarketAnalysis-Visual Analysis
- StockCharts.com
- Technical Analysis of the Financial Markets
- The Visual Investor
- VectorVest, Inc.
- Executive Premier Workshop
- One-Day Options Course
- OptionsPro
- Retirement Income Workshop
- Sure-Fire Trading Systems (VectorVest, Inc.)
- Trading as a Business Workshop
- VectorVest 7 EOD
- VectorVest 7 RealTime/IntraDay
- VectorVest AutoTester
- VectorVest Educational Services
- VectorVest OnLine
- VectorVest Options Analyzer
- VectorVest ProGraphics v6.0
- VectorVest ProTrader 7
- VectorVest RealTime Derby Tool
- VectorVest Simulator
- VectorVest Variator
- VectorVest Watchdog
