HOT TOPICS LIST
- MACD
- Fibonacci
- RSI
- Gann
- ADXR
- Stochastics
- Volume
- Triangles
- Futures
- Cycles
- Volatility
- ZIGZAG
- MESA
- Retracement
- Aroon
INDICATORS LIST
LIST OF TOPICS
PRINT THIS ARTICLE
by Gary Grosschadl
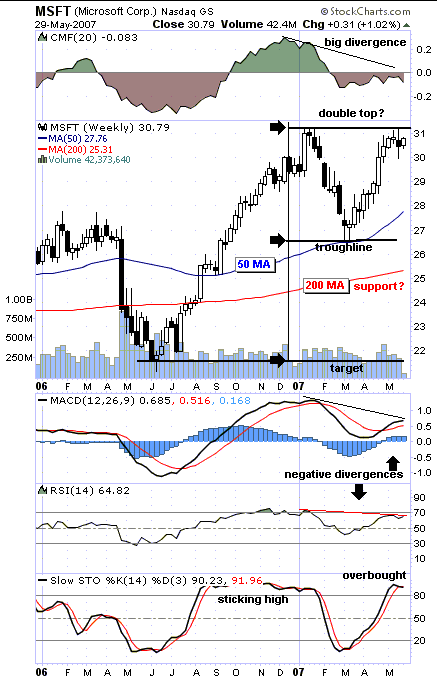
Microsoft has hit a previous resistance level just above $31. A confluence of candlesticks, symmetry, and indicators suggests a possible early warning of potential double top on this 17-month weekly chart.
Position: Sell
Gary Grosschadl
Independent Canadian equities trader and technical analyst based in Peterborough
Ontario, Canada.
PRINT THIS ARTICLE
DOUBLE TOPS
Microsoft Double Top?
06/01/07 08:36:15 AMby Gary Grosschadl
Microsoft has hit a previous resistance level just above $31. A confluence of candlesticks, symmetry, and indicators suggests a possible early warning of potential double top on this 17-month weekly chart.
Position: Sell
| A series of small bodied candlesticks at the top of any upleg suggests a tug-of-war between bulls and bears. These candles are often referred to as "spinning tops" by way of their physical appearance. This tug-of-war often points to a loss of momentum, a precursor to a downturn. |
| The two indicators below the chart in Figure 1 show more negative divergences to recent price action. The moving average convergence/divergence (MACD) and the relative strength index (RSI) show decreased bullishness at this second peak. When multiple negative divergences show up amid several technical indicators, a further rise in stock price becomes suspect. The stochastic oscillator reflects an overbought condition being above the 80 level, which suggests the likelihood of a coming downleg or downturn. However, this oscillator also shows what can happen when a strong uptrend occurs looking back to the last drive north of the 50-period simple moving average. This oscillator can "stick high" — that is, it stays above the 80 level for an extended time. This is a somewhat uncommon occurrence, so this is a great example of such an event. During this stochastic event, note the strong, rising trend in the aforementioned indicators. This is not the case currently. |

|
| FIGURE 1: MSFT, WEEKLY. A double-top danger is suggested here. |
| Graphic provided by: StockCharts.com. |
| |
| Should a double top prove to be in the making, the trendline (below $27) would have to be broken to the downside. A sustainable bounce here or above this point negates the double-top attempt. Note a potential support level at the 200-period moving average (MA) currently at $25.31. The 200-period MA in any time frame is often a trading target, so support or temporary support can come into play. Should this support level not hold, then the double-top completion target should be considered. The measured downside target for a double top is the distance from the peak to the bottom trendline, as applied to the downside break below this line. This brings the target to or near the $22 level. |
| In summary, this analysis hints at a potential double top for Microsoft (MSFT). A surprise move above the recent peak negates this bearish view. A bounce at or above the trendline also could turn this to a double-top test. A violation of the trendline validates the double top and brings the two lower targets into play. |
Independent Canadian equities trader and technical analyst based in Peterborough
Ontario, Canada.
| Website: | www.whatsonsale.ca/financial.html |
| E-mail address: | gwg7@sympatico.ca |
Click here for more information about our publications!
PRINT THIS ARTICLE

Request Information From Our Sponsors
- StockCharts.com, Inc.
- Candle Patterns
- Candlestick Charting Explained
- Intermarket Technical Analysis
- John Murphy on Chart Analysis
- John Murphy's Chart Pattern Recognition
- John Murphy's Market Message
- MurphyExplainsMarketAnalysis-Intermarket Analysis
- MurphyExplainsMarketAnalysis-Visual Analysis
- StockCharts.com
- Technical Analysis of the Financial Markets
- The Visual Investor
- VectorVest, Inc.
- Executive Premier Workshop
- One-Day Options Course
- OptionsPro
- Retirement Income Workshop
- Sure-Fire Trading Systems (VectorVest, Inc.)
- Trading as a Business Workshop
- VectorVest 7 EOD
- VectorVest 7 RealTime/IntraDay
- VectorVest AutoTester
- VectorVest Educational Services
- VectorVest OnLine
- VectorVest Options Analyzer
- VectorVest ProGraphics v6.0
- VectorVest ProTrader 7
- VectorVest RealTime Derby Tool
- VectorVest Simulator
- VectorVest Variator
- VectorVest Watchdog
